Also discussed here: Air pollution threat hidden as research 'presumes people are at home': study (The Guardian, Aug. 24, 2016)
And here: Urban air pollution is worse than we think—but better data might solve the problem (Barbara Eldredge, CURBED, Aug. 30, 2016)
Today we review research into a study in New York City that compared the exposure to urban air pollution during an active day at the place of work and travelling to that rather than as earlier exposure studies have done only at the place of residence. The results indicate, first of all, that the highest concentration of PM2.5 is not surprisingly in central Brooklyn and Queens and in the southern half of Manhattan Island. Pollution levels at places of work compared to those at residences was 10 μg/m3 higher which suggests that a higher congestion charge be applied to vehicles which enter the high emission zones (which is the basis for the [present congestion charge zone in London, UK) .Future applications of this research when self driving cars are the norm might involve automatically controlling their movement to avoid adding to the pollution levels in some packets of the city
Key Quotes:
“By harnessing cellular network information, researchers can see where urban populations move throughout the day, leading to better understanding of exposure to pockets of pollution. The MIT study focused on a particularly pernicious airborne particle, PM2.5—which is linked to asthma, heart disease, and poor lung function”
“This aim of this study was to quantify population-weighted exposure to air pollution by combining extensive population activity patterns and air pollution measurements. to evaluate population-weighted exposure to PM2.5 for New York City (NYC) and for 71 districts within the city”
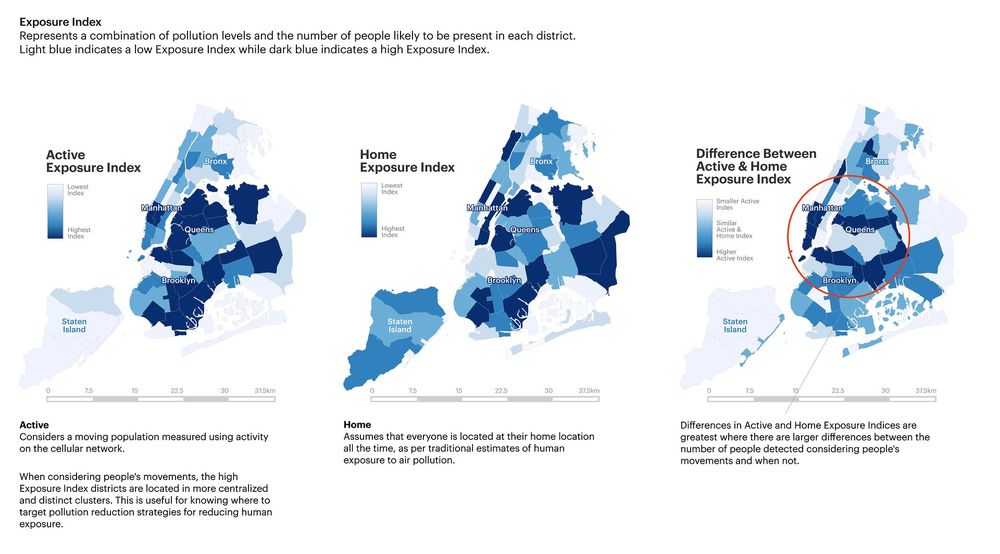
“The districts where the population-weighted PM 2.5 exposures are relatively higher are very clearly located within Midtown and Lower Manhattan, and centralized areas of Brooklyn and Queens…This was a result of higher proportions of New Yorkers spending time in busy districts for employment, recreational, and social activities “
“more incidences of PM 2.5 values lower than 10 μg/m3 in the Home scenario are observed in comparison to the Active scenario, in which more PM 2.5 exposure values greater than 10 μg/m3 are seen.”
“While evaluating where people are exposed to air pollution in the future using mobile phone based population activity estimates, this could assist in identifying where people are being exposed to levels above the WHO recommended limits. [10 μg/m3 in annual mean PM 2.5] exposure”
“One of the novelest future contributions from this research is that geo-referenced digital phone traces can also be used to decipher individual trajectories. Therefore, personal air pollution exposure studies could be conducted on cohorts incorporating locations of exposure through mobile phone and wireless device trace data. “


No comments:
Post a Comment