Thursday, April 30, 2015

Monitoring Air Pollution Exposure with a Smart Phone

Variability in and Agreement between Modeled and Personal Continuously Measured Black Carbon Levels Using Novel Smartphone and Sensor Technologies (Abstract, Mark J. Nieuwenhuijsen, David Donaire-Gonzalez, Ioar Rivas, Montserrat de Castro, Marta Cirach, Gerard Hoek, Edmund Seto, Michael Jerrett, Jordi Sunyer, Environmental Science & Technology, Feb, 2015)

Also discussed here: Turning smartphones into personal, real-time pollution monitors (ScienceDaily. ScienceDaily, Feb.18, 2015)

Today we review an article that describes a project at Barcelona in southern Spain involving the monitoring of exposure by 50 children from 29 schools using a smart phone and a sensor to measure black carbon during the day- at home, commuting to school and in school. While only 4% of their time was spent commuting, exposure was 13% of the daily total and this also had the highest levels while the levels at home were the lowest.

 cell phone aq  

Key Quotes:

“For 2 typical week days during 2012–2013, the children were given a smartphone with CalFit software to obtain information on their location and physical activity level and a small sensor, the micro-aethalometer model AE51, to measure their black carbon levels simultaneously and continuously”

“Although most children spent less than 4 percent of their day traveling to and from school, commuting contributed to 13 percent of their total potential black carbon exposure.”

“We found considerable variation in the black carbon levels during the day, with the highest levels measured during commuting periods (geometric mean = 2.8 μg/m3) and the lowest levels at home (geometric mean = 1.3 μg/m3)”

Tuesday, April 28, 2015

Where is the World’s Most Polluted City – Delhi or Beijing?

Delhi Wakes Up to an Air Pollution Problem It Cannot Ignore (Gardiner Harris, New York Times, Feb. 14, 2015)

Also discussed here: Mr. President, World’s Worst Air Is Taking 6 Hours Off Your Life (Natalie Obiko Pearson, Bloomberg, Jan. 26, 2015)

Today we review several articles about the state of air pollution in Delhi, India which is 15 times higher (153 micrograms per cubic meter) than the maximum level recommended by the World Health Organization. Not only is the air pollution poorer in Delhi than in Beijing but it is monitored at only 4 locations compared to more than 30 in Beijing. President Obama’s exposure to Delhi’s pollution (average 76 to 84 micrograms per cubic meter) during his recent 3 day visit may have reduced his life expectancy by 6 hours.

 delhi aq

Key Quotes: 

“Delhi has the world’s highest levels of PM2.5 -- tiny, toxic particles that lead to respiratory diseases, lung cancer and heart attacks. The Indian capital averaged 153 micrograms per cubic meter in 2013, the World Health Organization said in May, citing government data. That’s 15 times more than the average annual exposure recommended by the WHO.”

“India as a whole is home to 11 of the top 20 cities on the planet with the worst air quality, according to data from the WHO, which collected pollution levels from 1,600 metropolitan areas between 2008 to 2013”

“Already, an estimated 1.5 million people die annually in India, about one-sixth of all Indian deaths, as a result of both outdoor and the indoor air pollution, a problem caused in part by the widespread use of cow dung as cooking fuel. The country has the world’s highest death rate from chronic respiratory diseases, and more deaths from asthma than any other nation, according to the World Health Organization. Air pollution also contributes to both chronic and acute heart disease, the leading cause of death in India."

“One microlife represents 30 minutes of an average young adult s expected lifespan. The average person uses up about 48 microlives per day but lifestyle affects how fast one expends one s microlives. Settling in smoggy Beijing will use up roughly an additional 2-3 microlives per day, implying a reduction in life expectancy of almost three years. Living in Hong Kong or Santiago, Chile, will cost one additional microlife per day, whereas daily life in New Delhi, one of the world s most polluted cities, costs an estimated 4-5 microlives.”

 “Dung Obama’s three-day visit, PM2.5 levels in Delhi have averaged between 76 to 84 micrograms per cubic meter…Those levels translate roughly into an estimated loss of 2 hours a day in life expectancy, said David Spiegelhalter.. “That’s roughly 8 cigarettes a day”

“Beijing has more than 30 government monitors tracking its air quality, although the historical data is not widely available. Delhi has just four, in addition to one at the U.S. embassy”

Thursday, April 23, 2015

Are there Limits to the Burning of Carbon Fuels?

The geographical distribution of fossil fuels unused when limiting global warming to 2 °C (Abstract, Christophe McGlade & Paul Ekins, Nature, Jan. 7, 2015)

Also discussed here: The Limits to Fossil Fuel Use? (Wil Burns, Teaching Climate Law, Feb. 6, 2015)

 Today we review research into the implications of using fossil fuel reserves if the emissions from their use are to stay below the levels of greenhouse gases in the atmosphere that limit warming to 2 degrees C or less. The conclusions include the need to keep 82% of coal reserves in the ground, to cease production of bitumen in the Canadian oil sands by 2040 and to to keep 80% of unconventional natural gas reserves unburned by 2050 – even if carbon capture and sequestration is widely deployed, should it be found to be effective. The “Limits to Growth” on which the Club of Rome was founded now has application to the burning of fossil fuels.

 Limits for carbons  
Key Quotes:

“to have at least a 50 per cent chance of keeping warming below 2 °C throughout the twenty-first century, the cumulative carbon emissions between 2011 and 2050 need to be limited to around 1,100 gigatonnes of carbon dioxide (Gt CO2).. However, the greenhouse gas emissions contained in present estimates of global fossil fuel reserves are around three times higher than this  

Our results suggest that, globally, a third of oil reserves, half of gas reserves and over 80 per cent of current coal reserves should remain unused from 2010 to 2050 in order to meet the target of 2 °C”

“There is a massive gap between both estimated fossil fuel resources (nearly 11,000 Gt CO2) and reserves (nearly 2,900) and the 1100 gigaton carbon dioxide budget that may be necessary to avoid passing critical temperature thresholds”

“ 82% of coal reserves will need to remain unburned to not exceed the world’s carbon budget by 2050”

“ In terms of unconventional oil, natural bitumen utilization in Canada must become “negligible” by 2020, and without CCS, all bitumen production must cease by 2040.”

Tuesday, April 21, 2015

Global Estimates of Fine Particulate Matter from Space

The View from Afar - Satellite-Derived Estimates of Global PM2.5 (1 page pdf, Environmental Health Perspectives, Feb. 2, 2015)

Today we review research into recent global estimates of PM2.5 using space based sensors. Over the last decade, a trend toward worsening conditions in South and East Asia (with 51% more of the population exposed to pollution above WHO guidelines rose to 70%) and slightly improved conditions in the eastern USA and Canada (where the exposed population declined from 62% to 19%) was estimated from these satellite observations at a 10 km resolution. The authors expect in future that similar estimates may be made of NO2 concentrations at an improved resolution which may be more helpful in pin pointing urban pollution conditions and their sources.

  pm for USa china

 Key Quotes:

“More than 3 million people died prematurely in 2010 due to ambient exposure to fine particulate matter (PM2.5), according to estimates from the Global Burden of Disease Study

“We found notable trends of increasing PM2.5 in South and East Asia, where billions of people live. Meanwhile, parts of North America are getting cleaner,”

“In a sense, the satellites we use are little more than extremely well calibrated cameras that take pictures of the earth below. When aerosol particles are present, these pictures begin to look a little hazy,”

“The researchers used AOD data …to estimate ground-level PM2.5 at a spatial resolution of approximately 10 km × 10 km. Although some regions experienced a decrease in PM2.5 over the period 1998–2012, the global population-weighted average increased by an estimated 2.1% per year. Rising levels of air pollution in developing regions in South and East Asia largely drove the upward trend”

 “researchers estimated that the proportion of people in South and East Asia exposed to PM2.5 at levels exceeding the World Health Organization (WHO) interim target of 35 μg/m3 rose from 51% in 1998–2000 to 70% in 2010–2012. In contrast, the proportion of North Americans exposed to PM2.5 at levels above the WHO air quality guideline of 10 μg/ m3 fell from 62% in 1998–2000 to 19% in 2010-12”

 “Satellite-based estimates reported here will enable researchers to design and conduct large epidemiological studies in low- and middle-income countries that lack the extensive ground monitoring networks found in higher income countries,”

“In the future, we hope to infer global PM2.5 data at a higher spatial resolution and to investigate other air pollution compounds, such as nitrogen dioxide, using satellite data,”

Saturday, April 18, 2015

What is the Role for Business in Addressing Climate Change?

Climate Change’s Bottom Line (Burt Helm, New York Times, Jan. 31, 2015)

Also discussed here: RISKY BUSINESS: The Economic Risks of Climate Change in the United States (56 page pdf, Risky Business Project, Jun. 2014)

And here: Heat in the Heartland: Climate Change and Economic Risk in the Midwest (58 page pdf, Risky Business Project, Jan. 23, 2015)

And here: Stern Review: The Economics of Climate Change (662 page pdf, Nicholas Stern, chair of the Grantham Research Institute on Climate Change and the Environment at the London School of Economics, Oct. 30, 2006)

Today we review the work of the “Risky Business Project” which was formed by a group of high level business and political leaders in the USA who wish to examine the probably outcomes of continued inaction on climate change by their country (and the world) while calling for the need to adapt to and minimize those changes. Unlike most environmental issues which have been addressed by going to government action from problem identification, research and policy based on scientific evidence, climate change has been portrayed as an attack on personal liberty through increased government control, camouflaged as denial of the science.

The Risky Business project aims to swing the consensus in the USA from a debate on the science to a consensus based on evidence of economic impacts focused on regional assessments and both on the short and long term. A report similar to the Stern report for the UK estimates $15.8B economic impacts for the USA by 2100. If the Project succeeds in showing how climate change hits the pocket book and business profits, maybe we’ll see that long delayed and necessary action by
  business, the public sector and government. climatic extremes and the new normal  

Key Quotes:

“Our goal with the Risky Business Project is not to confront the doubters. Rather, it is to bring American business and government—doubters and believers alike—together to look squarely at the potential risks posed by climate change, and to consider whether it’s time to take out an insurance policy of our own.”

“When looking at climate change, it’s particularly important to consider the outlier events and not just the most likely scenarios. Indeed, the “outlier” 1-in-100 year event today will become the 1-in-10 year event as the Earth continues to warm. Put another way, over time the extremes will become the “new normal.”

“Our research combines peer-reviewed climate science projections through the year 2100 with empirically-derived estimates of the impact of projected changes in temperature, precipitation, sea levels, and storm activity on the U.S. economy”

 “I think it’s the existential threat of our day…Once you see it as having catastrophic impact, any economic argument follows that, because you’re not going to have an economy.”

 “Climate change would increase energy demand in Texas by between 3.4 and 9.2 percent by midcentury. Crop yields in Missouri and Illinois would face a 15 percent decline over the next 25 years. And in the Northeast, annual property damage from severe storms — from hurricanes to blizzards — would likely increase $11.1 billion, to a total of $15.8 billion by the end of the century.”

 “The whole point of all of this is that it can be mitigated…The enemies of what we’re trying to do are short-termism and a sense of hopelessness. But if we act soon we can avoid the worst outcomes and adapt.” “Congress tends not to act until the broad mainstream, including business, is aboard.”

Tuesday, April 14, 2015

Estimating Health Risks from Air Pollution Using Fixed Sites or Personal Monitors

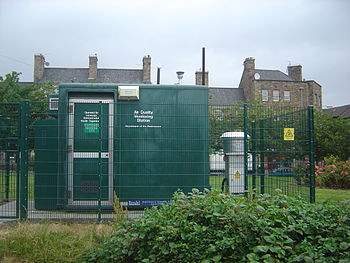
An air quality measurement station in Edinburg...
An air quality measurement station in Edinburgh, Scotland (Photo credit: Wikipedia)
Estimating risk of emergency room visits for asthma from personal versus fixed site measurements of NO2 (6 page pdf, Scott Weichenthal, Patrick Bélisle, Eric Lavigne, Paul J. Villeneuve, Amanda Wheeler, Xiaohong Xu, Lawrence Joseph, Environmental Research, Feb. 2015)

Today we review research from Windsor, Ontario which compared the exposure to NO2 from an Ogawa personal exposure meter to daily exposure estimated from a fixed nearby measurement site, part of the National Air Pollution Surveillance (NAPS) network and in reference to emergency asthmatic cases. Results indicated that next to zero correlation between the two values from a sample of almost 1,000 measurements. The authors concluded that more attention must be paid to how exposure to pollution is estimated for risk estimates in epidemiological studies. This has significant implications for urban air quality network design as
well.


Key Quotes:

“In this study, our aim was to apply a Bayesian measurement error adjustment method that accommodates both a change in scale and measurement error variance to adjust risk estimates from fixed site values to those from personal exposures”

 “In general, the weak correlation between short-term measures of personal and fixed-site NO2 observed in Windsor is consistent with existing evidence and suggests that caution is required when using fixed-site monitors to estimate short-term variations in personal NO2 exposures”

“Our findings suggest that risk estimates based on fixed-site NO2 concentrations may differ substantially from estimates based on personal exposures if the change in scale and/or measurement error is large. In practice, one must always keep the scale being used in mind when interpreting risk estimates and not assume that coefficients for ambient concentrations reflect risks at the personal level.”