Tuesday, May 31, 2011

e-Roads for e-Vehicles

Electric Roads May Be In Our Future (eMercedes Benz, May 4, 2011)

Also discussed here: Txchnologist: Coast To Coast On Electric Roads Without Stopping? (All Cars Electric, May 6, 2011)

Today’s review article describes a new application of an idea developed over 100 years ago which would power vehicles as they are driven on highways. This would lighten the significant load vehicles must carry with energy stored in batteries, which in turn reduces the energy demand, fuel consumption and emissions produced along roadways. It also means that the huge infrastructure of charging stations needed to support the next generation of e-vehicles would be met through electrified roads.


Key Quotes:

“Electric vehicles, or EVs, could pick up small amounts of electricity as they drive over charging pads buried under the asphalt and connected to the electrical grid. Researchers say that a continuously available power supply would allow EVs to cut battery size as much as 80 percent, drastically reducing vehicle cost.”

“Basically you get power directly from the grid to the motors as the car moves..You can travel from the West Coast to the East Coast continuously without charging.”

“Nicola Tesla first discovered the principles of wireless charging, or inductive power transfer, in the late 19th Century. It works by creating an electromagnetic charging field that transfers energy to a receiving pad set to the same frequency”

“Manufacturers are already marketing wireless charging pads for electric vehicles – retrofitted to accept the charges – that can deliver a 5-kilowatt charge with 90 percent efficiency from a distance of about 10 inches”

“it would be possible to transfer up to 30 kW of power at an average efficiency of 80 percent on the highway. Assuming that chargers would be available at home and work..a car would only need a battery big enough to make it to the nearest interstate or major road.”

“the cost of electrified roads, pegged at $1.5 million to 2.5 million per lane mile, could be made up through charging a toll along the roadway”

“the Korea Advanced Institute of Science and Technology, in South Korea, has begun testing for electric roads to charge an electric car that runs on low speed”
Enhanced by Zemanta

Monday, May 30, 2011

Lichens as Air Pollution Biomonitors

Lobaria pulmonaria, Schwäbisch-Fränkische Wald...Image via Wikipedialichens as biomonitors (Lichens of Ireland project)

Also discussed here: Monitoring Air Quality with Lichen as a Bioindicator (Abbie Walston, Mon’s clean air force, May 4, 2011)

And here: Lichen determination keys (Botanischer Garten und Botanisches Museum Berlin-Dahlem)

And here: Lichenland Lite (Northwest Alliance for Computational Science & Engineering (NACSE), based at Oregon State University.)

Lichens have long been known for their ability to indicate the state of air quality because pollutants accumulate in them. This results in either further growth or decay depending on the concentration and type of pollutant and lichen. A number of references have been collected here which allow one to assess the type of lichen.

Key Quotes:

“Some lichens will only survive in a clean environment, while others flourish with certain pollutants. For example, some species of the genus Xanthoria establish and grow abundantly in nitrogen rich areas, such as near farms or chemical factories, while species of the genus Usnea are sensitive to the amount of sulphur in the air”

“chemicals can freely invade them and interfere with their metabolic processes, often killing the lichen, but sometimes increasing their growth rate. Also, lichens are unable to excrete or secrete these chemicals and so they accumulate within the thallus. The lichen is therefore an excellent bioaccumulator”

“Hawksworth-Rose Sulphur Dioxide Pollution Scale:

Most Polluted (0) to Least Polluted (10)

0 = No lichens
1 = Desmococcus viridis (not a lichen, but a green alga)
2 = Lecanora conizaeoides
3 = Lepraria incana
4 = Hypogymnia physodes / Parmelia sulcata / Parmelia saxatilis
5 = H. physodes / P. saxatilis / Calicium viride / R. farinacea / E. prunastri / Platismatia glauca
6 = Parmelia caperata / Graphis elegans / Pseudevernia furfuracea
7 = Parmelia caperata / Usnea subfloridana
8 = Parmelia perlata / Normandina pulchella
9 = Lobaria pulmonaria / Dimerella lutea
10= Sticta limbata / Usnea articulata”

“Summarized list:
  • No lichens present – very poor air quality
  • Crustose lichens only – poor air quality
  • Crustose and foliose lichens – moderate to good quality (based on number of different lichens)
  • Fruticose, foliose and crustose lichens – very good air quality”
Enhanced by Zemanta

Friday, May 27, 2011

Zero Energy Houses and The Cube Project

The Cube Project

Also discussed here: 10X10X10 ft House (6 min video)

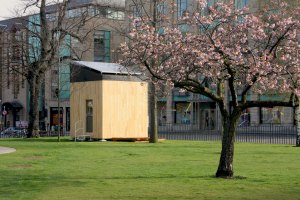
The focus of today’s review is a Zero Energy House conceived in the UK, suitable for one person (but can be scaled up for larger homes or buildings). In addition to generating zero waste and energy self-sufficient, it can produce £1000 per year by feeding unused electricity from solar panels back into the grid.


Key Quotes:

“The Cube Project is an initiative of Dr Mike Page at the University of Hertfordshire who set out to build a compact home, no bigger than 3x3x3 metres on the inside, in which one person could live a comfortable, modern existence with a minimum impact on the environment.

-includes a:
  • lounge, with a table and two custom-made chairs,
  • small double bed (120cm wide),
  • full-size shower, a kitchen (with energy-efficient fridge, induction hob, re-circulating cooker hood, sink/drainer, combination microwave oven and storage cupboards),
  • washing machine,
  • composting toilet.
  • ultra-efficient LED lights
  • air-source heat pump
  • solar photovoltaic panels(will raise around £1000 per year in FiT income)
  • connection to the electrical grid, and a cold-water supply
  • No mains drainage is required: waste is either composted, or processed on site
Enhanced by Zemanta

Thursday, May 26, 2011

Demand-based Parking Rates, Smart Phones and Less Congestion

Now, to Find a Parking Spot, Drivers Look on Their Phones (Matt Richtel, New York Times, May 7, 2011)

Also discussed here: SFpark

And here: Mayor Lee Launches SFpark Project (SFpark News, Apr. 21, 2011)

And here: SFpark overview (3 min video)

The focus today is on an innovative system to be introduced in the summer of 2011 that combines demand-based parking rates with a smart phone app (iPhone to start) that allows drivers to find unused parking spots and the rate charged- thus reducing traffic congestion by 30%, attributable to drivers cruising for empty spots. There is concern that this will distract drivers from watching for pedestrians and other cars and lead to accidents.


Key Quotes:

“With SFpark, San Francisco is the first city in the world to pursue a comprehensive parking-based approach to congestion management and greenhouse gas emission reduction that will also support local merchants and keep San Francisco moving.”

“The SFpark web site provides customers the ability to see parking availability and cost before heading out the door. The mapping tool on the home page shows location, high, low or medium availability and rate information for SFpark garages and on-street parking spaces.”

“The SFMTA will adjust rates based on demand to find the lowest hourly rate possible in each pilot area to achieve the right level of parking availability to make parking easier. Rates will be adjusted no more than once a month and only in small increments of no more than $0.50 per hour. The goal of these pricing adjustments is to have at least one open parking space on every block at most times and parking garages that rarely fill up”

“It could be really distracting.. Most people are looking for parking spaces in places that have a lot of traffic and a lot of pedestrians.”

“drivers looking for parking in a particular 15-block district in Los Angeles drove an estimated 950,000 miles a year, equivalent to four trips to the moon”

“In pilot areas, meter pricing can range from between 25 cents an hour to a maximum of $6.00 an hour, depending on demand. During special events, such as baseball games, hourly prices may temporarily increase beyond the $6.00 ceiling.
Enhanced by Zemanta

Wednesday, May 25, 2011

How Does Personal Rapid Transit (PRT) Compare to Pubic Transit?

Op-Ed. On relative costs of PRT, auto and public transit (Eric Britton, World Streets, Apr. 29, 2011)

Also discussed here: Evaluating Public Transit Benefits and Costs (123 page pdf, Todd Litman, Victoria Transport Policy Institute, Apr. 15, 2011)

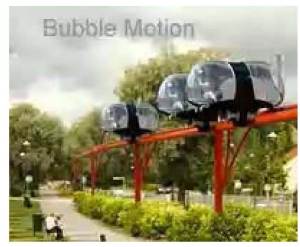
And here: Bubble Motion PRT concept (BM Design, slideshow, April 2011)

And here: Personal Rapid Transit (PRT) network - Cutting Car Use in Daventry (Colin Buchanan)

One of my favourite sources of information about transportation modes and the maestro for the World Streets blog, Erik Britton, borrows some recent facts from another key transportation guru, Todd Litman, to present a list of factors that need to be considered in assessing transit and personal rapid transit with private vehicles.


Key Quotes:

Factors to consider in comparison:
  • “Automobiles require a vehicle, road space and parking facilities at every destination
  • Motor vehicles only serve the portion of travelers who can afford them and are able to drive or hire a driver
  • A large portion of automobile travel consists of chauffeured trips
  • Expanding urban roadways often simply shifts the location of traffic congestion
  • Automobile travel is very resource intensive, requiring 10-100 times as much land area for roads and parking, and 10-1,000 times as much non-renewable energy, as the same trips made by walking, cycling and public transport
  • A typical car is only operated one or two daily hours, compared with 14-18 for a typical bus. A typical car lasts 10-15 years, a typical bus or train 15-40 years”
  • PRT systems require passengers to travel in enclosed “pods” with strangers, which creates insecurity problems
“efficiency and equity require that automobile users be charged the full costs for the roads, parking facilities and fuel they consume, while there are good reasons for society to subsidize some public transit costs, and where there are conflicts (such as limited road space), favor public transit over automobile travel, since it is more efficient and equitable”
Enhanced by Zemanta

Tuesday, May 24, 2011

Did London’s Congestion Charging Scheme Improve Its Air Quality?

The Impact of the Congestion Charging Scheme on Air Quality in London: Part 1. Emissions Modeling and Analysis of Air Pollution Measurements (121 page pdf, Frank, Kelly H., Ross Anderson, Ben Armstrong, Richard Atkinson, Ben Barratt, Sean Beevers, Dick Derwent, David Green, Ian Mudway, and Paul Wilkinson , Research Report 155, Health Effects Institute Apr.26, 2011)

Also discussed here: No air quality benefit from London's traffic levy (Reuters, Apr. 27, 2011)
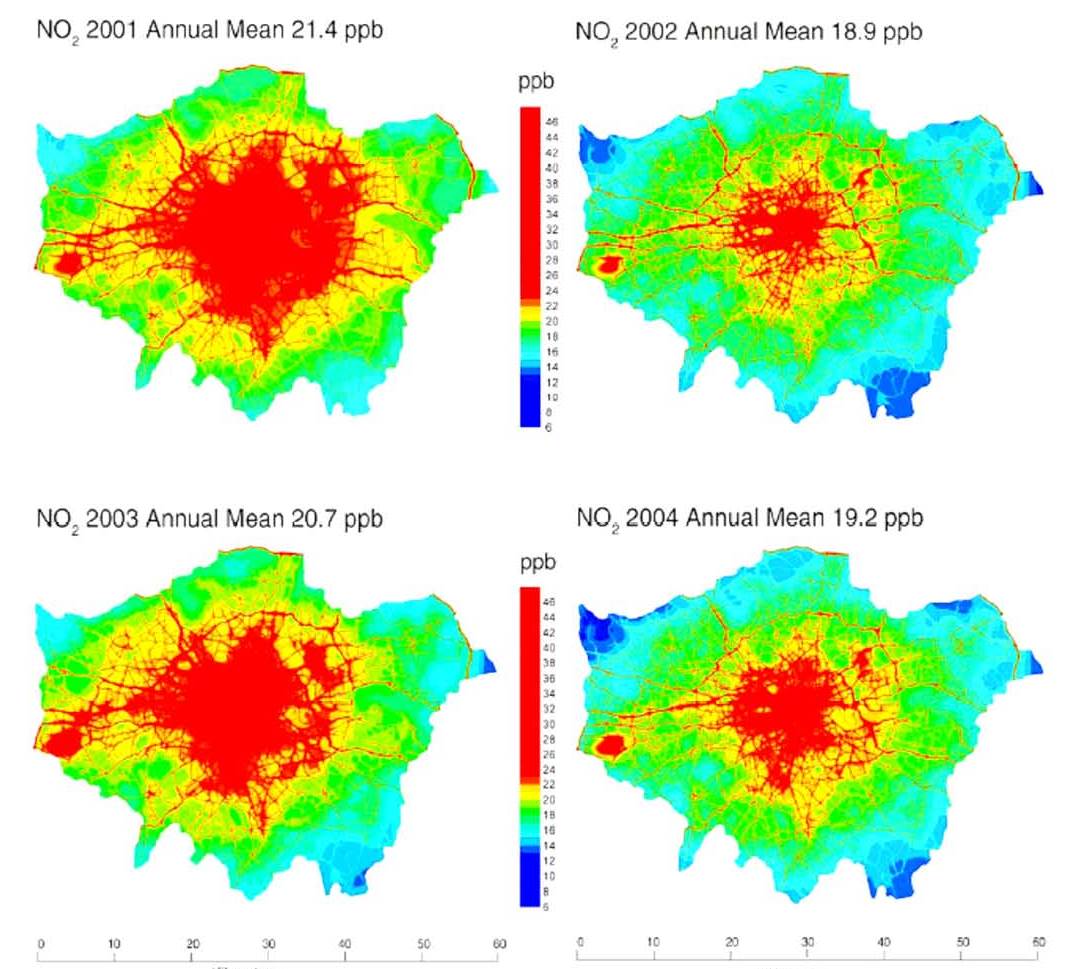
The focus of today’s review is an analysis of the changes resulting from the implementation of the Congestion Charging Scheme in London, using modelling and ground measurements. The results seem to point to little significant change in local air quality which may have been masked by other measures taken to reduce traffic congestion which did improve.


Key Quotes:

“Within the CCZ [Congestion Charging Zone], the investigators projected a net decline of 1.7 ppb in the annual average mean NOx concentration and a decline of 0.8 μg/m3 in PM10”

“the area covered by the CCS [Conjestion Charging Scheme]— approximately 1.4% of Greater London — was likely too small to influence air pollutant levels substantially either within or outside the zone”
"air pollution does not know precise boundaries so any benefit of the CCS or air quality appears to have been lost in the larger regional pollution mix,"

“London's congestion charge was a world leading traffic intervention and ..would be of use to other administrations considering introducing traffic management schemes so that they can achieve vehicle reductions as well as improving air quality at the same time."

“other changes, such as increased used of diesel-powered taxi and bus trips to transport people in and out of the congestion charge zone, may have offset any benefits.”

“Finally, their experience highlights the challenges of using existing monitoring networks, even one as well-established as the LAQN, for the purposes of measuring small changes in air quality”

“the most interesting result was the modest suggestion that metals that have been associated with tire and brake wear might contribute to the oxidative activity levels observed.”
Enhanced by Zemanta

Friday, May 20, 2011

Traffic Air Pollution and Health Impacts in Urban Italy

Urban air pollution and emergency room admissions for respiratory symptoms: a case–crossover study in Palermo, Italy (39 page pdf, Fabio Tramuto, Rosanna Cusimano, Giuseppe Cerame, Marcello Vultaggio, Giuseppe Calamusa , Carmelo M Maida and Francesco Vitale, Environmental Health 2011, 10:31, Apr.13, 2011)

Today’s review article takes us to Palermo, Italy which happens to have a good data base of 10 air pollution monitoring stations and the characteristic (seen only in a few large cities with little local industry, such as Ottawa in Canada) of pollution coming mainly from traffic- although it was acknowledged that some SO2 comes from vessels in its port. The conclusions point to high correlations between poor respiratory health and high levels of air pollution, particularly PM10.


Key Quotes:

“The burden of air pollution on health system is generally underestimated for the difficulties to clearly evaluate the possible linkage between air pollution level and adverse health outcomes partially due to the variability of personal exposure, to the influence of individual effect modifiers [12] but also because respiratory symptoms are often neither consulted nor registered in medical records as related to air pollution”

“[in Palermo] Due to limited use of domestic heating plants and to the lack of industrial plants in residential areas, motor vehicles, including boats, contributes to at least 70-75% of total air pollutant emissions”

“a positive association between ER attendance for respiratory symptoms and ambient exposure to motor-vehicle pollutants such as PM 10 , nitrogen dioxide, sulfure oxide, and carbon monoxide was found, and a clear difference by season was observed. PM 10 was the sole pollutant that showed positive OR values in both the warm and cold seasons”

“Traffic-related air pollution includes gaseous species and PM from combustion, tire and brake wear, and resuspended roadway dusts”

“the study shows that warm season increases the risk of respiratory health effects due to motor vehicle-related air pollution, especially in females”
Enhanced by Zemanta

Thursday, May 19, 2011

Does the Charging of Hybrid Cars Produce Significant Pollution?

Air quality impacts of plug-in hybrid electric vehicles in Texas: evaluating three battery charging scenarios (12 page pdf, Tammy M Thompson, Carey W King, David T Allen and Michael E Webber, Environmental Research Letters, Volume 6, Number 2, Apr. 19, 2011)

Today’s focus is on the impact of the charging of hybrid cars on air quality because of emissions from the sources of electricity (at night) which would replace the emissions from the mobile sources mainly daytime. The modelling experiment took place in one of the states with higher levels of pollution. The conclusion appears to be that the shift does not have a significant impact on the environment.


Key Quotes:

“Two of the largest sources of emissions that lead to ozone formation are vehicles and electricity generating units (EGUs). Increasingly, these two emission source categories are becoming intertwined, through the use of plug-in hybrid electric vehicles (PHEVs)”

“When operating on electricity, PHEVs have no tailpipe emissions. However, emissions are released when fuel is burned to generate electricity at power plants for charging these vehicles”

“shifting emission sources from urban, daytime tailpipes of gasoline-powered cars to (often) rural, stacks of power plants burning coal or gas can have a significant impact on photochemical air pollutant formation.”

“The impact of PHEVs on ozone is dominated by the impact associated with mobile NO x emissions decreases”

“The potential air quality impact of PHEVs is dominated by the impact of the NO x decreases from mobile sources. In most cases the decrease in NO x emissions due to PHEVs causes a decrease in 8 h average ozone concentrations during the day when the maximum value is likely to occur. The result is a likely decrease in the daily maximum 8 h average ozone concentration, the value used to determine attainment of the 8 h standard”

“Nighttime increases in ozone are less likely to impact humans because fewer people are awake and outside and therefore fewer people are being exposed to higher ozone during nighttime hours. Thus, the switch of 20% of LDV VMT from gasoline to electric travel shifts ozone formation to a time period that is likely less harmful to humans”
Enhanced by Zemanta

Wednesday, May 18, 2011

Public Health and the Built Environment in Ontario

Public Health and Land Use Planning: How Ten Public Health Units are Working to Create Healthy and Sustainable Communities (232 page pdf, Kim Perrotta, Clean Air Partnership, April 2011)

Today’s focus is on a report that reviews of factors in the built environment and in land use planning affecting health, including a summary of the different approaches used by rural, urban and suburban public health units across the province of Ontario (with over 10 M population).


Key Quotes (on air pollution aspects):

“across Canada in 2008, seven common air pollutants contributed to approximately:
  • 2,682 premature deaths occurring from short-term elevations in air pollution (1,000 in Ontario); 42 per cent of them related to cardiovascular disease and 11 per cent to respiratory conditions;
  • 18,318 premature deaths from long-term exposure to air pollutants (8,500 in Ontario);
  • 11,000 hospital admissions; 60 per cent related to cardiovascular conditions and 40 per cent due to respiratory conditions;
  • 92,000 emergency room visits;
  • 620,000 doctor's office visits; and
  • Over 20 million minor illnesses (CMA, 2008)”
“the cost of these health effects at $8 billion in 2008 “

“on average, for every 10 ug/m3 increase in long-term air levels of PM2.5:
  • Mortality from all causes increases by approximately 10 per cent; and
  • Mortality from cardiovascular disease increases by 3 per cent to 76 per cent with some groups, such as women and obese individuals, having greater risks than members of the general population (Brook et al, 2010)”
“The lowest income populations in Toronto and Montreal were 3.5 and 2.8 times, respectively, more likely to live within 200 metres of a highway than the highest income populations; and

Twenty-five per cent of people from the lowest income populations in Canada's urban regions live within one kilometre of a pollution-emitting facility while only seven per cent of people from the highest income populations do”

“the City of Toronto has estimated that 190 premature deaths could be avoided, and $900 million in health benefits could be realized, each year, if vehicle emissions in Toronto were reduced by 30 per cent by encouraging a shift to other modes of travel”

“A review of 15 different studies conducted by the World Health Organization found that concentrations of air pollutants along traffic corridors were 1.2 to 2.3 times higher than background levels in those urban areas”

"The most susceptible (and overlooked) population in the US subject to serious health effects from air pollution may be those who live near major regional transportation routes, especially highways…."

“a doubling of CO2 concentration in the atmosphere, central Canada could experience a five-fold increase in air masses that bring smog episodes, high temperatures and high humidity..heat-related death rates in the Toronto area could increase to between 9.63 and 33.65 per 100,000”
Enhanced by Zemanta

Tuesday, May 17, 2011

Highest Ranked Cities in USA for Air Quality

This annual ranking of the most sustainable cities in the USA points to cities in the Northwest at the top across all categories (Portland was #1 overall) and to the Pacific coast for both the best and worst for air quality. Some lessons learned from looking at cities which moved up and down are of general significance- such as New Orleans, which after the flooding in 2005, replaced dirty old fleet vehicles with cleaner new ones.


Key Quotes:

Honolulu – “The Pacific island city owes its clean air to ocean breezes that blow pollution out to sea”

Fresno, California – “With a high concentration of agricultural operations, dairy farms, busy Interstates (5 and 99), and being stuck downwind from Los Angeles, the inland valley city finished dead last”

New Orleans – “In the wake of Hurricanes Katrina and Rita, the city government replaced 100 percent of its (flood damaged) fleet with alternative fueled vehicles, which may account for some of the improvement”

Top 10- “Leading”

1. Honolulu, HI
2. Portland, OR
3. New Orleans, LA
4. San Francisco, CA
5. Oakland, CA
6. Virginia Beach, VA
7. Seattle, WA
8. Miami, FL
9. Austin, TX
10. Minneapolis, MN

“Fresno, California can thank its less-than-lucky coordinates for its finish too: With a high concentration of agricultural operations, dairy farms, busy Interstates (5 and 99), and being stuck downwind from Los Angeles, the inland valley city finished dead last”

Bottom 10 - “Endangered”

41. Houston, TX
42. Atlanta, GA
43. Chicago, IL
44. El Paso, TX
45. Las Vegas, NV
46. Mesa, AZ
47. Phoenix, AZ
48. Long Beach, CA
49. Los Angeles, CA
50. Fresno, CA
Enhanced by Zemanta

Monday, May 16, 2011

Triggering of Inflammation Response by Fine Particulate Matter

TLRImage by AJC1 via FlickrDysfunction via NADPH Oxidase and TLR4 Pathways - Chronic Fine Particulate Matter Exposure Induces Systemic Vascular (29 page pdf, Qinghua Sun, Henning Morawietz and Sanjay Rajagopalan, Nitin P. Padture, Sampath Parthasarathy, Lung Chi Chen, Susan Moffatt-Bruce, Deiuliis, Xiaohua Xu, Nisharahmed Kherada, Robert D. Brook, Kongara M. Reddy, Thomas Kampfrath, Andrei Maiseyeu, Zhekang Ying, Zubair Shah, Jeffrey A., Circulation Research, Jan. 27, 2011)

Also discussed here: Polluted Air Leads to Disease by Promoting Widespread Inflammation (Science Daily, Apr. 14, 2011)

Today’s review article discusses the way that fine particulate matter interacts with white blood cells (in mice) to cause widespread inflammation which in turn has impacts on the lungs and circulation.


Key Quotes:

“Chronic inhalation of polluted air appears to activate a protein that triggers the release of white blood cells, setting off events that lead to widespread inflammation”

PM 2.5 air pollution has been linked with endothelial dysfunction, systemic inflammatory and oxidative stress responses and the progression of atherosclerosis”

“It is increasingly apparent that biological systems commonly use evolutionarily conserved mechanisms to sense a variety of environmental signals. Toll-like receptors (TLRs) play a central role in the recognition of a broad diversity of environmental and pathogen associated molecular patterns

"Our main hypothesis is that particulate matter stimulates inflammation in the lung, and products of that inflammation spill over into the body's circulation, traveling to fat tissue to promote inflammation and causing vascular dysfunction,"

"We haven't identified the entire mechanism, but we have evidence now that activation of TLR4 influences this response."

"The free radicals can have a high impact on vascular function,"

"This is a sign that the monocytes are responding to inflammatory stimuli -- which in our case is particulate matter -- and then in turn they can cause more inflammation because they release inflammatory factors,"

"After exposure, there is an increase in oxidized phospholipids in the lung fluid. ..What we do know is that the increase in oxidized phospholipids in turn promotes inflammation."

” Our results provide mechanistic proof of the existence of a significant contribution of the bone marrow and potentially spleen in response to chronic PM 2.5 exposure”
Enhanced by Zemanta

Friday, May 13, 2011

The Global Impacts of Vehicle Emissions on Climate Change

Climate, health, agricultural and economic impacts of tighter vehicle-emission standards (8 page pdf, Drew Shindell, Greg Faluvegi, Michael Walsh, Susan C. Anenberg, Rita Van Dingenen, Nicholas Z. Muller, Jeff Austin, Dorothy Koch and George Milly, Nature Climate Change, Mar. 29, 2011)

Also discussed here: Cleaner Vehicle Standards Good for Health, Agriculture, Climate (National Aeronautics and Space Administration, Apr. 1, 2011)

Also here: The Benefits of Stronger air pollution standards for Cars and Trucks (Next Big Future, Apr. 4, 2011)

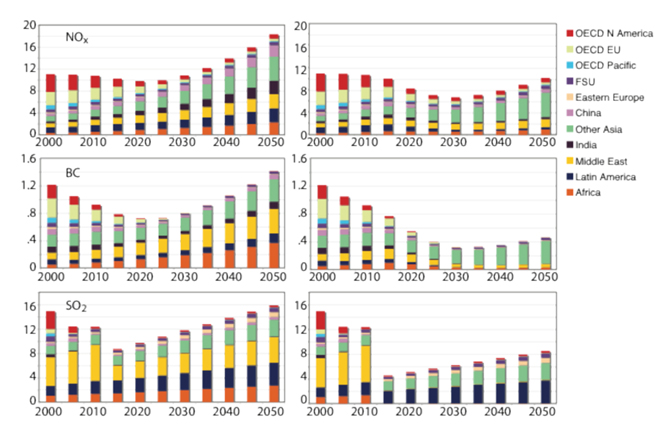
Today’s review article looks at the link between vehicle emission and climate change and how that affects human health, agriculture and the economy around the world. What is most striking perhaps is the shift of the largest emissions from North America to India and China on the one hand and the overall increase in each of the major pollutants over the next 40 years- with consequences in terms of premature deaths and agricultural crop losses. The other interesting aspect is a comparison of more stringent vehicle emission restrictions in Europe to weaker ones elsewhere- and the impact of this difference in terms of climate change and impacts.


Key Quotes:

“Although much is known about how vehicle emissions affect air quality, there have been fewer studies of how vehicle emissions affect climate.. Emission controls affect individual pollutants differently.. vehicle emissions vary regionally, depending on vehicle ownership and usage rates, vehicle types, and emission and fuel standards,”

“Emission scenarios were developed for the years 2000 2050 in five-year increments for nitrogen oxides (NO x ), carbon monoxide (CO), volatile organic compounds, sulphur dioxide (SO 2 ), black carbon (the strongly absorbing fraction of particulate carbon emissions), organic carbon, methane, nitrous oxide and hydrofluorocarbons”

“Imposition of tight standards can also reverse the baseline increase in deaths between 2000 and 2030 owing to vehicle emissions in China, India, Latin America, Africa and the Middle East”

“current vehicle-emission trends, if fully implemented, will substantially decrease radiative forcing, premature deaths and ozone-related agricultural yield losses for North America and Europe, with the opposite for Africa and the Middle East. For China, India and Latin America”

"The adoption of aggressive standards by 2015 would set the world on a course to prevent the deaths of 200,000 people, save 13 million tons of cereal grains from ozone damage, and save $1.5 trillion in health damages each year after 2030.. For comparison, the United Nations estimated that the earthquake and tsunami that struck the northeast coast of Honshu had caused about 27,600 deaths and produced between $185 and $308 billion in damages at the end of March. Hurricane Katrina killed 1,836 people and produced about $81 billion in damages."
Enhanced by Zemanta

Thursday, May 12, 2011

The Impact of Pedestrian Zones on Urban Air Quality

NEW YORK - MAY 26:  People sit in lounge chair...Image by Getty Images via @daylifeMayor Bloomberg Announces Latest Results of Health Department Air Quality Study that shows Air in Times Square is Cleaner and Healthier since Pedestrian Plazas were Opened (New York City, PR- 120-11, Apr. 13, 2011)

Also discussed here: Times Square pedestrian plazas a breath of fresh air (AM New York, Apr. 13, 2011)

And here: Study finds air is cleaner in Times Square (New York News, Apr. 13, 2011)

Today’s news article speaks to the impact that pedestrian or car-free zones actually have on the air quality in and around these zones. New York City’s decision to clear traffic away from Times Square has resulted in 50-60% lower levels of nitrogen oxides- the pollutant most associated with vehicle emissions.


Key Quotes:

“We created pedestrian plazas right in the heart of our City to straighten out some of the chokepoints in our street grid and to help traffic flow more smoothly and quickly through Midtown,”

“the number of cars moving through Times Square on Broadway and Seventh Avenue at 44th Street declined from 2,400 per day during peak times to 1,550 once the pedestrian plazas opened. Levels of nitric oxide and nitrogen dioxide, which are associated with lung irritations, declined 63 percent and 41 percent, respectively, in the area”

“That cleaner air ... makes a huge difference to the health of more than a quarter million pedestrians who pass through Times Square everyday”

“The air monitoring, conducted from December 2008 to December 2009, also found that traffic-related air pollutants “did not worsen in other midtown locations — in fact, they improved slightly”

“The Health Department estimates that PM2.5 pollution in New York City is responsible, annually, for 3,200 premature deaths, 1,200 hospitalizations for respiratory conditions, 900 cardiovascular hospitalizations, and 2,400 child and 3,600 adult emergency department visits for asthma”
Enhanced by Zemanta

Wednesday, May 11, 2011

Analysing Transportation Options in New York City

Meet the BTA (35 page pdf slideshow, Jul. 22, 2009)


Also discussed here: Transit Plans from Kheel Team (Nurture New York's Nature - NNYN)

And here: Balanced Transportation Analyzer (2.8 MByte Excel 2007 spreadsheet)

Today’s review is of a sophisticated spreadsheet developed by Charles Komanoff to model the impact of various congestion pricing schemes in New York City with time varying rates on such outputs as revenue gains and losses (as shown below), impact on traffic volumes, vehicle emissions, speeds and many other variables. In carrying out the calculations in iterative fashion, many policy results may be assessed. The technique shows promise to be exported for use in other cities if the basic input data are provided. Note that the spreadsheet file referenced will execute only in post 2007 versions of Excel.


Key Quotes:

“Balanced Transportation Analyzer -A spreadsheet model to assess benefits, impacts and costs of time-variable traffic and transit pricing in New York City”

” Inputs:
  • Baseline motor vehicle data; Cordon entries; Time of day and Day of week; Cordon and non-cordon speeds
  • Baseline subway and bus data: Ridership and revenue;Time of day and Day of week
  • Elasticities (price and time sensitivities)”
“Outputs:
  • Agency revenues
  • Motor vehicle travel speeds
  • Time savings to vehicle users (hours and dollar equivalents)
  • VMT and transit ridership
  • Emissions and other vehicle externalities”
Uses:
  • “Traffic pricing essential to improving vehicle travel
  • Traffic pricing a revenue source for transit
  • Time-varied pricing can: Maximize time savings, Provide choice, Ease subway crowding”
Enhanced by Zemanta

Tuesday, May 10, 2011

A New Look at the Ecological Footprint

Development of Ecological Footprint to an Essential Economic and Political Tool (17 page pdf, Hans P. Aubauer, Sustainability, Apr. 12, 2011)

The concept of a single measure of sustainability, the basis for the Ecological Footprint, is analyzed in the article reviewed today. The various deficiencies are addressed by combining the EF with three other indices with good results for planning the future.


Key Quotes:

“the four criteria of sustainability:
  1. Anthropogenic material flows must not exceed the local assimilation capacity and should be smaller than natural fluctuations in geogenic flows.
  2. Anthropogenic material flows must not alter either the quality or the quantity of global material cycles and their natural buffer stocks.
  3. Renewable resources can only be extracted at a rate that does not exceed the local fertility.
  4. The natural variety of species and landscapes must be sustained or improved"
“the concept of the Ecological Footprint can be developed by incorporating the six procedures:
  • operating within the boundaries of the sustainable local yields of the biologically productive soil and water areas, without any input of non-renewable resources, particularly fossil fuels
  • taking spatial variations of this yield into account;
  • considering only sustainable CO2 -sinks;
  • including every exploitation of nature, for instance all material flows;
  • taking care of intertemporal effects and depletion;
  • preserving the natural habitats necessary for the survival of biodiversity, bearing the species/area relationship in mind”
“the EF has some serious deficiencies:

*he forest areas assumed for carbon sequestration in the EF cannot store the CO 2 permanently and finally emit it into the atmosphere again

*The renewable biomass output of a square meter of bioproductive area, used in the EF, is not an output of this area alone. It includes the input of non-renewable resources..which do not come from this area, and are added to it from lithosphere stocks

*The EF also does not take into account future yield reductions or yield changes due to changes in land use.

“it was decided in this paper to combine the EF with three other indicators ―Human Appropriation of Net Primary Production ―Environmentally-weighted Material Consumption and ―Land and Ecosystem Accounts

“an indicator of just resource distribution between and within generations, and a benchmark for decision-making between alternative types of consumption, life-styles and economic policies, results”
Enhanced by Zemanta

Monday, May 9, 2011

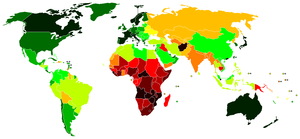
How Does Air Pollution Affect Life Expectancy?

Life Expectancy UN 2005-2010How to determine life expectancy change of air pollution mortality: a time series study (35 page pdf, Ari Rabl, Tq Thach, Pyk Chau and Cm Wong, Environmental Health, Mar.31, 2011)

Today’s review article examines the important question asked when a policy to improve air quality, such as a congestion pricing, is introduced- what difference would this make to mortality rates and life expectancy? The authors used data from Hong Kong and found a lower bound only to the answer, restricted as they were to a 5 year window used to assess the correlation lag between cause and effect.


Key Quotes:

“For rational environmental policy one needs to know the life expectancy (LE) gain that can be obtained by a permanent reduction in exposure”

“there are two distinct features that are reflected in the coefficients of a TS with extended observation window: one is the lag between exposure and the resulting premature deaths, the other is the magnitude of the individual LE losses corresponding to those deaths. The present paper examines what can be learned from TS about LE loss”

“Air pollution does not change the total number of deaths, it merely advances the date of deaths"
” A calculation according to Eq.10 (but with time step 4 years instead of 1 day) yields an LE loss of 39 days per 10 mg/m3 increase of black smoke and 48 days per 10 mg/m3 increase of SO2.. Typical results are around 90 days per 10 mg/m3 of PM 10
Enhanced by Zemanta

Friday, May 6, 2011

Impacts of Nano Particulates from Urban Traffic on the Brain

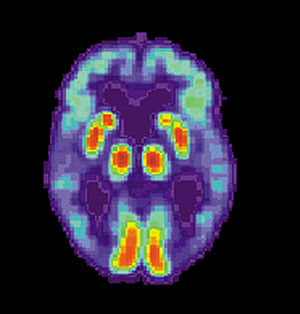
PET scan of a human brain with Alzheimer's diseaseImage via WikipediaGlutamatergic Neurons in Rodent Models Respond to Nanoscale Particulate Urban Air Pollutants In Vivo and In Vitro (31 page pdf, Todd E Morgan, David A Davis, Nahoko Iwata, Jeremy A Tanner, David Snyder, Zhi Ning, Winnie Kam, Yu-Tien Hsu, Jeremy W Winkler, Jiu-Chiuan Chen, Nicos A Petasis, Michel Baudry, Constantinos Sioutas, Caleb E Finch, Environmental Health Perspectives, Apr. 7, 2011)

Also discussed here: Freeway air bad for mouse brain (Science Blog, Apr. 7, 2011)

Although today’s review article is highly technical and the result of experiments conducted on mice, the implications for the impact of nano-sized vehicle emissions on human brain development is clear. “The evident neurotoxicity of nPM suggests links between urban air pollution and brain health across the lifespan”. Two areas need further study: definition for nano particles within the Ultra Fine Particle (UFP) category of air quality standards and the accumulation of nPM in the brain over time.

Key Quotes:

“cognitive functions are vulnerable to airborne pollutant exposure across the lifespan. In older women, low cognitive function was associated with proximity to vehicular traffic.. middle-aged adults, lower cognitive performance was associated with exposure to ozone. Cognitive impairments of school-age children have been associated with exposure to black carbon”

“it is clear that the inhaled particle size is critical: the nano-size class of PM (< 200 nm) from engineered materials had the greatest toxicity and uptake by vascular and brain cells”

“Inhaled nPM can act on the brain directly and indirectly. Direct entry of inhaled nPM may occur via transport by olfactory neurons from the nasal mucosa.. Another possible route is though peripheral monocytes, which regularly enter the pool of brain microglia, with enhanced entry during peripheral inflammation”

“We therefore studied neuronal cell responses to nPM in vivo after chronic exposure for 10 weeks, using a new technique of re-aerosolized nPM collected from urban freeway air for 30 days”

“These in vitro models suggest that nPM has both direct neurotoxicity through glutamatergic mechanisms and indirect neurotoxicity through glial secretions”

“after short-term exposure to vehicle pollution, mice showed significant brain damage — including signs associated with memory loss and Alzheimer’s disease.”

“An important unknown is the actual brain accumulation of inhaled PM, which may be transported inside the brain by olfactory neurons from the nasal mucosa”

“It’s a long-term global project to reduce the amount of nanoparticles around the world. Whether we clean up our cars, we still have to clean up our power generation.”
Enhanced by Zemanta