Friday, June 28, 2013

Recent Research Linking Heart and Lung Disease to Air Pollution

Exhaust gases from vehicles form a significant...
Exhaust gases from vehicles form a significant portion of air pollution which is harmful to human health and the environment (Photo credit: Wikipedia)
Long-term air pollution exposure and cardio- respiratory mortality: a review(32 page pdf, Gerard Hoek, Ranjini M Krishnan, Rob Beelen, Annette Peters, Bart Ostro, Bert Brunekreef, Joel D Kaufman, Environmental Health, May 28, 2013)
 
Today we summarize a literature review that assessed evidence for the link between air pollution and deaths from lung or heart disease, in light of developments over the last decade in terms of the knowledge gained and the greater geographical data set including, specifically, China and Japan. Also the traditional and to some extent successful response to vehicle emissions over the last few decades was to reduce tailpipe emissions, leading this review to look more closely at non tailpipe emissions such as brake lining wear and emissions or particulates from the oil crankcase and tires. Results indicate that for every increase of 10 μg/m3 increase in PM2.5 exposure, there is an additional health risk of 6%.


Key Quotes:
“Exposure contrasts related to traffic emissions are usually poorly represented by the concentration of PM10 or PM2.5, because of the high regional background concentration of these particle metrics from other sources… there are more specific markers for traffic related air pollution, which include elemental carbon and ultrafine particles number”
“Emission controls for road traffic have now substantially reduced tailpipe emissions, and therefore non-tailpipe emissions including engine crankcase emissions (combusted lubricating oil), road, tire and brake wear are becoming increasingly important”
“As traffic-related air pollution varies on a small spatial scale, it is even more critical to assess exposure on a fine spatial scale such as the residential address than for PM2.5.”
“Respiratory mortality may be more related to primary traffic-related pollutants than with long-range transported particles, though further work is needed to test this hypothesis.”
“The pooled effect estimate expressed as excess risk per 10 μg/m3 increase in PM2.5 exposure was 6% .. for all-cause and 15% …. for cardiovascular mortality."
Enhanced by Zemanta

Wednesday, June 26, 2013

Protecting Cyclists on Urban Roads

Inventory of Protected Green Lanes(Green Lane Project)  

Also discussed here: Memphis to Add 15 Miles of Protected Bike Lanes(Angie Schmitt , StreetsBlogNetwork, May 23, 2013)

And here: Why Are Some Cities Safer for Cycling?(Pollution Free Cities, Jul. 19, 2011)  

And here: Segregated Bike Lanes(Pollution Free Cities, Oct. 12, 2009)

And here: Who owns the road in Montreal?(Pollution Free Cities, Oct. 3, 2009)

Today we review the progress being made in cities in the US and Canada of protection of cyclists on busy city roads through the addition of “protected” or “segregated” bike lanes which often separate cars from bikes by a raised curb. While Canada’s capital probably has the most and longest segregated bike parks (at 541 km, planned to increase to 2,500 km), many US cities are planning to double the number of protected lanes from the current 103 in the next year. The “Green Lane Project” provides a spreadsheet detailing the location and length of these lanes in each city which can be found by following the links above. The hoped for result would be to reduce the number of injuries and deaths caused by the merging of fast-moving vehicle
 traffic with cyclists.
  seg bike path  

Key Quotes:

“a “green lane,” adds physical separation between moving cars and bikes, such as a curb, parked cars or plastic posts. Between 1874 and 2011, only 62 of these facilities were built nationwide… this number will nearly double to 102 protected green lanes on the ground in 32 U.S. cities by the end of 2012.. by the end of 2013, more than 200 green lanes will be on the ground”

“Memphis embarked on an ambitious campaign to add 55 miles of bike infrastructure.”

 “We’re working hard to make sure we’re not just building quantity, but that we’re building quality bike lanes. We want all our citizens, young and old, to be able to make the choice to bicycle and feel safe and comfortable when doing so. Green lanes are how we’re going to take the next step to make Memphis the most bike-friendly city in Tennessee.”

Ottawa currently (2008) has 541 km of bike paths, including 258 km off-road paths and is planning on over 2,500 km”

“With 560 kilometres of designated bike lanes built or under construction on the island, Montreal is ahead of the pack among North American cities”
Enhanced by Zemanta

Monday, June 24, 2013

How do Household Pets Affect Indoor Air Quality and Health?

Home Life: Factors Structuring the Bacterial Diversity Found within and between Homes(8 page pdf, Robert R. Dunn, Noah Fierer, Jessica B. Henley, Jonathan W. Leff, Holly L. Menninger, PloS One, May 22, 2013)

Also discussed here: You dirty, dirty dog: Homes with canines swarming with bacteria(Amberly McAteer,The Globe and Mail, May 23, 2013)

Today we review research aimed at indoor air quality and in particular the difference that the air quality in a house with a dog differs from one without one. Results indicate the former has many many more microbactieria and a higher health risk than the latter, including the risk of developing allergies which has long been hypothesized but not tested. On the other hand, the existence of these bacteria also seem to a sort of immunity for children growing up in this environment that does not exist in a more pristine environment.

pets and indoor AQ  
Key Quotes:

“this work provides the first comprehensive analysis of the microbial communities found in the home and the factors that shape the structure of these communities both within and between homes.”

“nearly all homes have some level of natural ventilation that would allow for outdoor microbes to gain entry into the home, and we did find evidence that the types of bacteria found outside the home influence the types found inside the home as there was a significant correlation between outer and inner bacterial communities across homes.”

“When you bring a dog into your house,you are not just bringing a dog, you are also introducing a suite of dog-associated taxa directly into your home environment, some of which may have direct or indirect effects on human health.”

“The presence of dogs had significant effects on both the diversity and the types of bacteria found within homes on surfaces that may be in direct contact with dogs (e.g., pillows) and those that they are unlikely to ever touch (television screens).”

 “The presence of dogs had a significant effect on bacterial community composition in multiple locations within homes as the homes occupied by dogs harboured more diverse communities and higher relative abundances of dog-associated bacterial taxa.”

 “research suggests that pregnant mothers who live in houses with dogs are less likely to give birth to children who go on to develop allergies or atopic dermatitis.”
Enhanced by Zemanta

Friday, June 21, 2013

Hyperactivity of Children exposed to Traffic-related Pollution

map
map (Photo credit: Wikipedia)
Traffic-Related Air Pollution Exposure in the First Year of Life and Behavioral Scores at Seven Years of Age(26 page pdf, Nicholas Newman, Patrick Ryan, Grace LeMasters, Linda Levin, David Bernstein, Gurjit K. Khurana Hershey, James E. Lockey, Manuel Villareal, Tiina Reponen, Sergey Grinshpun, Heidi Sucharew, and Kim N. Dietrich, Environmental Health Perspectives, May 21, 2013)  

Also quoted here: Early-Life Traffic-Related Air Pollution Exposure Linked to Hyperactivity 
(HealthCanal, May 21, 2013)
 
Today we review research that looked at the link between exposure to air pollution from traffic with hyperactivity in children. This is a particularly important question because so many schools in the USA and Canada are located near busy roads and highways (40% within 400 m in the USA and even more worrisome, 50% within 50 m in Ottawa, Canada). Results indicate that there is a significant link for children of parents with higher than average education- a curious result which seems in turn to be associated with the impact of traffic-related pollution on brain development.

Key Quotes:

“Early-life exposure to traffic-related air pollution was significantly associated with higher hyperactivity scores at age 7
 
"There is increasing concern about the potential effects of traffic-related air pollution on the developing brain….This impact is not fully understood due to limited epidemiological studies.”

"Several biological mechanisms could explain the association between hyperactive behaviors and traffic-related air pollution,…including narrowed blood vessels in the body and toxicity in the brain’s frontal cortex.”

“studies have shown that approximately 11 percent of the U.S. population lives within 100 meters of a four-lane highway and that 40 percent of children attend school within 400 meters of a major highway”
Enhanced by Zemanta

Wednesday, June 19, 2013

What’s Wrong with Estimating Traffic Congestion Using GPS Statistics?

The problems with measuring traffic congestion (Felix Salmon, Reuters, Oct. 17, 2012  

Also discussed here: The problems of measuring traffic congestion (Road Pricing, May 15, 2013)

And here: TomTom Congestion Index(Tom Tom, Mar. 22, 2013) And here: TomTom North American Congestion Index(68 page pdf, Tom Tom, Mar. 22, 2013)

Today we review an article that criticizes the effort to estimate congestion in 120 cities world-wide by a major GPS producer, TomTom. The author, Felix Salmon, points out several issues that reduce confidence in the city by city congestion indices: the lack of an independent measure of congestion that would calibrate the GPS-based estimates, the assumption that the speeds of vehicles using the GPS represent the speeds of the average or all vehicles on the road at the time and the weight given to various road segments being measured. The bottom line is that the efforts to reduce congestion by road pricing require a sound way of measuring congestion in order to recognize success or failure of the pricing method used in a given city. While TomTom should be congratulated for its efforts so far, it seems that a second or third objective and consistent way of measuring congestion is needed.

 tom tom congestion  

Key Quotes:

 “A congestion index like this one serves two purposes.
  • to compare a city to itself, over time: is congestion getting better, or is it getting worse?
  • to compare cities to each other: is congestion worse in Washington than it is in Boston?”
“TomTom only looks at road segments where they have a large sample size of traffic speeds — big enough to give “statistically sound results.. The next step is weighting the different road segments, giving most weight to the most-travelled bits of road…But if you want to work out where a city’s drivers drive the most and drive the least, then you need a much larger and much more representative sample….TomTom is always going to get data weighted heavily towards people who don’t know where they’re going — out-of-towners, or drivers headed to unfamiliar destinations.”

“measuring congestion on a percentage basis tends to make smaller, denser cities seem worse than they actually are”

 “the whole idea of congestion charging has a very big problem at its core. There’s no point in implementing a congestion charge unless you think it’s going to do some good — unless, that is, you think that it’s going to decrease congestion”
Enhanced by Zemanta

Monday, June 17, 2013

Ranking Emission Sources Harmful to Health in Europe

Contribution from the ten major emission sectors in Europe and Denmark to the health-cost externalities of air pollution using the EVA model system – an integrated modelling approach(26 age pdf, J. Brandt, J. D. Silver, J. H. Christensen, M. S. Andersen, J. H. Bønløkke, T. Sigsgaard, C. Geels, A. Gross, A. B. Hansen, K. M. Hansen, G. B. Hedegaard, E. Kaas, and L. M. Frohn, Atmospheric Chemistry and Physics, Mar. 6, 2013)

Also discussed here: The cost of air pollution impacts on health (Science for Environment Policy, May 16, 2013)

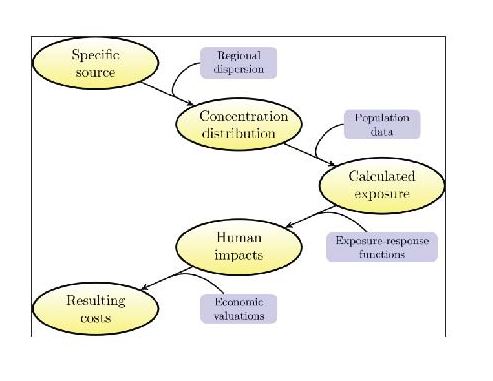
Today we review the estimates of the health impacts of ten European emission sources using a model that included nonlinear processes along the source to receptor pathway. Results indicate that the top three were power production, agriculture and road traffic, although this result could be different when applied in a different year (given the influence of meteorology on the result) or a different region of the world – in Scandinavia and Canada for example, most of the power production is carried out using non-polluting renewable energy resources, unlike many EU power sources which depend on coal. The approach deserves wider application because it recognizes the contributions from less obvious or visible emission sources. modeling health impacts  

Key Quotes:

 “The main objective of this work is to identify the anthropogenic emission sources in Europe and Denmark that contribute the most to human health impacts using this tagging method….capable of calculating the contribution from a specific emission source or sector to the overall air pollution levels, taking into account the non-linear atmospheric chemistry.”

 “most of the atmospheric chemical compounds are linked via non-linear chemical reactions, which are important to take into account.”

 “the model applied a tagging method that considers the transport of emissions and the possible production of other harmful compounds en route. Over 58 chemical compounds were considered and eight classes of particulate matter. “

 “Non-linearity in the source-receptor relationship is particularly evident for certain atmospheric components, such as NOx, VOC, O3, PM, SO2, and NH3” “the major contributors from European emissions to the total health-related external costs in the whole of Europe (in order of impact) are power production, agriculture, road traffic, non-industrial (domestic) combustion (including wood combustion), combustion in manufacturing industry, other mobile sources, production processes and solvents and other product use.”

 “in 2000, the sectors contributing most to the Europe-wide health cost were industrial power production (24% of costs), agriculture (24% of costs) and road transport (18% of costs). “
Enhanced by Zemanta

Friday, June 14, 2013

What Do You Need to Know to Build a Net-Zero Energy Home?

Strategies to Achieve Net-Zero Energy Homes: A Framework for Future Guidelines Workshop Summary Report(51 page pdf, Nancy A. McNabb, Engineering Laboratory, National Institute of Standards and Technology, April 2013)

Also discussed here: Strategies to Achieve Net-Zero Energy Homes(Science Daily, May 15, 2013)

Today we review a guide to build new homes or restructure old homes to achieve net zero energy which is defined as “buildings that generate as much energy through renewable means as is consumed by the building”. The guide is broken down to address design technology and equipment as well as the challenge of resistance to change in terms of human behavior. Such adverse side effects of more air tight houses and the impact on indoor air quality are discussed. The goal of the federal government is to realize 50% of all commercial buildings in the USA to be net zero by 2050. netzero house  

Key Quotes:

 “Key Questions:
  • What are the key characteristics of future NZE homes and the residential building community?
  • What are the challenges and barriers that impede the design, construction, and purchasing of NZE homes?
  • What are the potential concepts that could be included in a future guidance document for the residential building community to aid in the design and construction of NZE homes? “
“Some NZE concepts (e.g., tighter building envelopes) could potentially impact indoor air quality (IAQ). IAQ control technologies, such as heat recovery ventilation, novel ventilation concepts, and approaches to reducing outdoor air requirements, will support net-zero homes by ensuring that indoor environmental conditions are maintained and potentially improved.”

Risk factors include those related to the adoption of unfamiliar technology; limited ways to measure the performance and benefits of technology; a lack of integration of NZE concepts into current financing mechanisms; and cost (both initial and operating costs). Risk aversion or a reluctance to change was identified as one of the most important barriers because it translates into reluctance on the part of builders to incorporate new technologies with unfamiliar performance histories. “

Externalities that exert influence outside the domain of the home design and building industry can also create impediments. Diversity and inconsistency in energy policies at the federal, state, or local levels creates uncertainty about investment decisions that involve energy efficiency or on-site electricity generation. “

"Consumers require information that is useful, timely and understandable to be able to make the energy purchase and consumption decisions necessary to achieve net-zero energy for new and existing homes,"
Enhanced by Zemanta