Thursday, July 30, 2015

How is Air Pollution Linked to Diabetes?

Association between Ambient Air Pollution and Diabetes Mellitus in Europe and North America: Systematic Review and Meta-Analysis (9 page pdf, Ikenna C. Eze, Lars G. Hemkens, Heiner C. Bucher, Barbara Hoffmann, Christian Schindler, Nino Künzli, Tamara Schikowski, and Nicole M. Probst-Hensch, Environmental Health Perspectives, May 1, 2015) 

Today we review the results of a literature search for refereed studies or reports linking diabetes with air pollution. The search revealed over 680 reports and 13 studies that were conducted in Europe or North America- but not in developing countries. Analysis showed strong evidence linking inflammation from air pollution linked to the occurrence of Diabetes Type 2. Future studies need to take account of possible biases or unrelated causes of diabetes (such as obesity) as well as the need for this kind of research in developing countries where indoor air pollution is more likely to be a factor.

English: The blue circle is the global symbol ... 
The blue circle is the global symbol for diabetes, introduced by the International Diabetes Federation with the aim of giving diabetes a common identity, supporting existing efforts to raise awareness of diabetes and placing the diabetes epidemic firmly in the public spotlight. (Photo credit: Wikipedia)[/caption] 

 Key Quotes: 

“Persons with type 2 diabetes mellitus (T2DM) are at increased risk to develop micro- and macrovascular diseases and reduced lung function” 

“13 studies on different types of diabetes. The identified epidemiological evidence is highly diverse: Levels, timing, and assessment of exposure varied, as did the outcome definitions, measures of association, and degree of confounder control.” 

“There is strong evidence supporting the role of inflammation in T2DM …Chronic activation of inflammatory mechanisms can contribute to chronic insulin resistance and subsequent T2DM. Air pollution has been shown to be inflammatory “ 

“Future studies should report scales of exposure assessment (pollutant quantification and traffic exposure proxies) that allow direct comparisons with existing evidence” 

“Adjusting for noise exposure is also essential because air pollution and noise can be correlated”  

Tuesday, July 28, 2015

How is Europe Dealing with Air Pollution from Agriculture?

Clean Air from our Farms (4 page pdf, European Environmental Bureau Position Paper, Apr. 28, 2015)

Also discussed here : Infographic: How agricultural emissions affect our health (European Environmental Bureau, Apr. 28, 2015)

Today we review a note from the European Environmental Bureau which focuses on emissions and pollutants from agriculture which makes up 10% of all greenhouse gas emissions and 40% of the methane from the EU, and impacts both the air(acid rain), soil and human health. A National Emissions Ceilings Directive, issued in 2013, set new targets for ammonia, PM2.5 and methane among other pollutants, with a focus on livestock and manure management as well as croplands and the use of fertilizers and pesticides.

  eeb_ag_infographic_hr-01  

Key Quotes :

 « Agricultural emissions in Europe contribute to several environmental problems such as plant damage, eutrophication, acidification, acid rains(that damage plants, lakes and biodiversity), greenhouse gas emissions and ozone formation. However, these emissions also lead to health issues, such as respiratory diseases and result in a shorter life expectancy for humans.”

 “more than 90% of EU ammonia emissions (2011) come from Agriculture and around 40% of the total EU emissions from agriculture in 2012 are methane emissions. The agricultural sector was responsible for over 10% of EU total greenhouse gas emissions in 2012”

“The NECD revision [National Emissions Ceilings Directive, 2013] proposal sets new targets for the four initial pollutants, including ammonia (NH3). And it also for the first time includes limits for PM2.5 and methane (CH4)”

 “the new measures should focus on livestock, soils (50% of EU total agricultural emissions) and manure management(one sixth of the EU total agricultural emissions). In addition, croplands, which occupy more than half the territory of the EU, emit large amounts of volatile pollutants due to fertilizers and pesticides’ use"

Thursday, July 23, 2015

How has Climate Change Affected the Frequency of Extreme Weather Events?

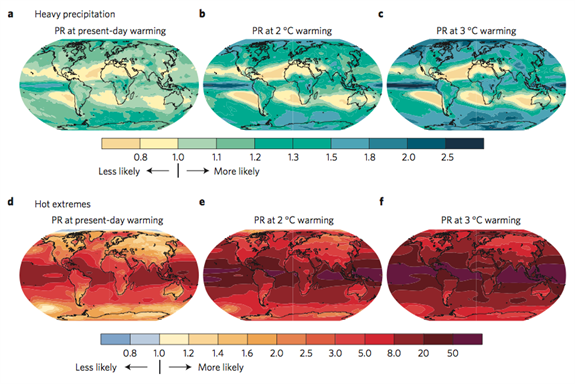
Anthropogenic contribution to global occurrence of heavy-precipitation and high-temperature extremes (Abstract, E. M. Fischer &R. Knutti, Nature Climate Change, Apr. 27, 2015)

Also discussed here: Human activity responsible for three out of four heat extremes, study finds (Roz Pidcock, The Carbon Brief, Apr. 27, 2015)

Today we review climate modeling research that examines the how the frequency of extreme weather events over the long term has and is being changed by the addition of greenhouse gases to the atmosphere. Results indicate that in addition to an average global warming of 0.85 C over the last 100 years that the probability of the temperature at a location exceeding a given threshold has tripled so that a daily maximum above 35C, say, that once occurred once in 3 years now occurs every year. When the global temperature has increased by 2C which is the present aim for international policy makers under existing climate change protocols, the probability of a hot day will increase 5 times compared to present day frequencies. Likewise the additional moisture that warmer air can carry has increased and this leads to heavier and more frequent rain storms and floods, especially in the tropics. While the link between climate warming and more frequent extreme events has been known in general terms for a long time, this is the first time that a quantitative number has been put on that- which has major impacts on insurance as well as on policy dealing with climate change. chances of climate chnage  

Key Quotes:

“75% of extreme hot days and 18% of days with heavy rainfall worldwide can be explained by the warming we've seen over the industrial period….Global temperature today is about 0.85C above what it was before the industrial revolution

"Warmer temperatures overall create more hot days, and warmer air can hold and transport more moisture, which at some point must come down. These physical principles have been known for decades." "This result has strong implications for the discussion of different mitigation targets in climate negotiations, where differences between targets are small in terms of global temperature, but large in terms of the probability of extremes."

"The idea that in a 2C world almost half of heavy rainfall events would not have occurred were it not for climate change is a sobering thought for policymakers seeking to mitigate and adapt to climate change." "The global view is relevant for a large country, for example, to estimate the risks of extreme weather overall, no matter where it happens, or for reinsurance, agriculture and food security, where the aggregated damages matter."

"The damage depends on how much infrastructure is there, on building standards, protection measures, on warning systems, disaster response, etc., so the same weather event can lead to much more or much less damage depending on what or who is there, and how those people are prepared and respond to that threat."

"I think we need to go one stage further and model the contribution of anthropogenic climate change to the actual impacts of extreme weather, and then compile a global inventory of harm, not just of meteorological events, if we are to arrive at an objective assessment of loss and damage due to anthropogenic climate change."

Tuesday, July 21, 2015

Finding Post 2020 Targets for GHG Emission Reductions

Comparing Countries’ Emissions Targets - A Practical Guide (20 page pdf, Australian Government Climate Change Authority, March 2015)

Also discussed here: Comparing countries’ emissions targets (Australian Government Climate Change Authority, March 2015)

And here: Australia's future emissions reduction targets (43 page pdf, Australian Government Climate Change Authority, April 2015)

Today we review a guide from the Australian government that compares GHG reduction targets from other countries or regions with similar economies (such as the USA and the EU), using four criteria: Capacity, Adequacy, Responsibility and Effort and differences in base year. Australia, (like Canada) has one of the highest per capita emission rates in the world (at 25-27 tonsCO2e/year) as well as a strong economy, governance institutions and advanced technology. It’s unconditional emissions target implies a 32% reduction/capita from 2005 levels by 2025 which is higher relatively than the US or EU. Another significant factor is the cost to make reductions and the capacity of a country’s economy to bear that wither in absolute or relative terms. However, costs are difficult to estimate and may be influenced by actions of other countries as well as the technology used. The Intended Nationally Determined Contributions (INDCs) for participating countries will be announced in advance of the Paris conference in December 2015. australia post 2020 ghg targets  

Key Quotes:

“1990 is a reasonable point to start in most circumstances. Distant past emissions occurred when their impact was not well understood or foreseen. From 1990, however, there was widespread global recognition of the risks of climate change and the need to reduce greenhouse gas emissions. The UNFCCC was agreed in 1992 and the Kyoto Protocol adopted in 1997. Both used 1990 as a baseline for targets.”

“Within the UNFCCC talks, post-2020 targets are known as Intended Nationally Determined Contributions (INDCs), and will be announced over the course of 2015. All countries are likely to compare their targets with others’, both in deciding what their targets should be, and in the course of negotiating the new global climate agreement”

“Targets are the most common type of emissions reduction goal, and typically state an intended level of emissions (or emissions intensity) in a certain year. Emission budgets, on the other hand, specify a total limit on emissions over a period of time…Because climate change is caused by cumulative global emissions over very long periods of time, budgets can ensure more consistency of action with climate science over time, and demonstrate the trade-offs between early and later action.”

“This guide first discusses how to ensure comparisons are fair, explaining the four central criteria (Capacity, Adequacy, Responsibility and Effort) and how to compare like with like.”

“Australia’s unconditional emissions target of 5 per cent reduction by 2020 from 2000 levels implies a 32 per cent reduction in emissions per person from 2005 levels”

 “A country’s costs may be strongly influenced by action of other countries. Costs are often overestimated due to tendency to underestimate the rate of changes in technology and broader innovation.”

Thursday, July 16, 2015

How Will Norway Deal with Less Fuel Tax Revenue while Reducing Carbon Emissions?

Norway reviewing future of fuel tax (Road Pricing, Apr. 24, 2015)

 Today we review a short note on the status of fuel taxes and road tolls in Norway which like Canada is blessed with both considerable hydroelectric power and oil and natural gas resources. Norway has a much greater network of roads with tolls as well as many more electric cars than Canada. With the drop in oil prices and, as a result, reduced revenue from fixed fuel taxes, both countries have to decide how to manage the revenue side from fuel taxes and road pricing, as well as the movement toward lower carbon emissions which has been boosted by various incentives for electric cars (which tends to favour higher income owners) which are not available for heavy vehicles and trucks. The resulting decision may favour higher tolls. This is one option not available to oil producing countries, such as the USA and Canada, where tolling is much less seen.


Norway toll roads  

Key Quotes:

"Incentives for electric cars: 
  • Toll free use of roads; 
  • Zero charges for public car parks; 
  • Access to bus lanes; 
  • Free use of car ferries; 
  • -Free use of public vehicle charge points.” 

“20% of all vehicles sold last year were electric, with Norway alone representing one third of all such vehicles sold in Europe “

“Norway has many toll roads, not just the relatively well known Oslo toll ring (which effectively operates as a congestion charging cordon), but on major highways across the country, with 40 currently listed”

Fuel tax is US$3.87 per gallon (US$1.02 per litre) including a tax on CO2.”

“its neighbour Sweden has an influence, as having taxation [on fuel] significantly lower than Sweden will encourage some informal and illegal trade across the border”

Tuesday, July 14, 2015

If You Live Close to Traffic, Your Brain will Shrink

Long-Term Exposure to Fine Particulate Matter, Residential Proximity to Major Roads and Measures of Brain Structure (Abstract, Elissa H. Wilker, Sarah R. Preis, Alexa S. Beiser, Philip A. Wolf, Rhoda Au, Itai Kloog, Wenyuan Li, Joel Schwartz, Petros Koutrakis, Charles DeCarli, Sudha Seshadri, Murray A. Mittleman, Strole, American Heart Association, Apr. 23, 20-15)    

Also discussed here: Long-term exposure to air pollution may pose risk to brain structure, cognitive functions (ScienceDaily, Apr. 23, 2015)  

And here: Air pollution could increase risk of dementia (Laura Donnelly, The Telegraph, Apr. 23, 2015)
    
And here: Smog may be harming your brain (Health24, Apr. 24, 2015)                

Today we review research on heath impacts on the brain from long term exposure to vehicle emissions from nearby traffic. A slight increase in PM 2.5 (by 2 μg/m3) was associated with a decrease in cerebral brain volume equivalent to an extra year of aging. This suggests the air pollution is associated with structural brain aging, even in dementia, and with a 50% greater risk of having a silent stroke which results from a blockage in the blood vessels supplying the brain.. The mechanism that links the brain to air pollution is unclear but the authors suggest that inflammation from fine particles in the lungs is likely important.

      
brain_2502748b
       
Key Quotes:    

 “the study found that an increase of only 2µg per cubic meter in PM2.5, a range commonly observed across metropolitan regions in New England and New York, was associated with being more likely to have covert brain infarcts and smaller cerebral brain volume, equivalent to approximately one year of brain aging.”      

"The mechanisms through which air pollution may affect brain aging remain unclear, but systemic inflammation resulting from the deposit of fine particles in the lungs is likely important."    

 “This study shows that for a 2 microgram per cubic meter of air (μg/m3) increase in PM2.5, a range commonly observed across major US cities, on average participants who lived in more polluted areas had the brain volume of someone a year older than participants who lived in less polluted areas. They also had a 46 percent higher risk of silent strokes on MRI,"      

 “A 2-μg/m3 increase in PM2.5 was associated with −0.32%...smaller total cerebral brain volume and 1.46 …higher odds of covert brain infarcts. Living further away from a major roadway was associated with 0.10 greater log-transformed white matter hyperintensity volume for an interquartile range difference in distance”      

“researchers who studied more than 900 participants of the Framingham Heart Study found evidence of smaller brain structure and of covert brain infarcts, a type of "silent" ischemic stroke resulting from a blockage in the blood vessels supplying the brain.”      

“Exposure to elevated levels of PM2.5 was associated with smaller total cerebral brain volume, a marker of age-associated brain atrophy, and with higher odds of covert brain infarcts. These findings suggest that air pollution is associated with insidious effects on structural brain aging even in dementia- and stroke-free persons.”      

"Our findings suggest that air pollution is associated with insidious effects on structural brain aging, even in dementia- and stroke-free individuals."              

Thursday, July 9, 2015

How Many Canadians Live Close to Vehicle Emissions from Major Roadways?

Development of a land-use regression model for ultrafine particles in Toronto, Canada (Abstract, Kelly Sabaliauskas , Cheol-Heon Jeong, Xiaohong Yao, Christopher Reali, Tim Sun, Greg J. Evans, Atmospheric Environment, Apr. 2015)

Also discussed here: Traffic emissions may pollute one in three Canadian homes (ScienceDaily, Apr. 21, 2015)

Today we review research into exposure to ultra-fine particles, especially those emitted by old vehicles. One third of all Canadians and half of the population of Toronto are exposed to health risks because they live within 250 m of a major roadway. 21,000 Canadians die prematurely each year because of air pollution and a large part of these deaths result from living too close to major roadways. Policy changes at the provincial and federal levels are needed to target older more polluting cars, as well as at the municipal level, to zoning plans to locate buildings and homes that house those most vulnerable from being close to traffic-related pollution – such as day cares, seniors residences, hospitals and schools. toronto pm  

Key Quotes:

“One in three Canadians, and half of all Torontonians, lives within 250 meters of at least one major roadway”

"We used to think that living near a major road meant that you lived near a lot of air pollution…But what we're finding is that it's not that simple, someone living right on a major road in the suburbs may not be exposed to as much pollution as someone living downtown on a side street near many major roads."

 "It used to be that we measured air quality on a regional or city scale…But now we're starting to understand that we need to measure air quality on a more micro scale, especially around major roadways."

“The Canadian Medical Association attributes 21,000 premature deaths each year in Canada to air pollution.”

"The ultrafine particles are particularly troubling…Because they are over 1000 times smaller than the width of a human hair, they have a greater ability to penetrate deeper within the lung and travel in the body."

 "The most surprising thing we found was how broad the range of emissions was…As we looked at the exhaust coming out of individual vehicles, we saw so many variations. How you drive, hard acceleration, age of the vehicle, how the car is maintained--these are things we can influence that can all have an effect on pollution."

“ their research may someday lead to policy changes that could help better target the small number of vehicles that pollute the most, as well as to better decide where to build schools, hospitals, daycares, seniors residences and other structures to protect people who are especially vulnerable to air pollution.”