Thursday, January 28, 2016

Where is the Worst Traffic Congestion in Canada?

How Bad is the Traffic Where You Live? (Zack Gallinger and Arik Motskin, The 10 and 3, Dec. 10, 2015)

Also discussed here: Which Canadian city has the worst traffic? (Alexandra Pope, Canadiana Geographic, Dec. 10, 2015)

And here: Vancouver has the worst traffic in Canada, new congestion study claims (Jake Edmiston, National Post, Mar. 31, 2015)

And here: TomTom Traffic Index - Measuring congestion worldwide (TomTom, 2016)

Today we review new data showing which city has the worst traffic. By one measure, TomTom’s 2014 traffic index show Vancouver with 35% as the worst, followed by Toronto (31%), Ottawa (28%) and Montreal during the day but this changes during the evening rush hour to Toronto and Vancouver tied at 66% followed by Ottawa at 63%. Another measure, the average stretch multiplier, the ratio between free flowing and congested traffic, shows Toronto as the clear winner/loser with 2.8 with Calgary and Ottawa gaining rapidly as equally sprawled and growing large cities.

 canada_traffic_map  

Key Quotes:

“the Canadian gridlock problem cost the average commuter nearly 79 hours last year, up from 77 hours in 2013”

“Vancouver again ranked third in North America — just behind the notorious traffic of Los Angeles and Mexico City.Toronto was a close second to Vancouver in the Canadian rankings, with Ottawa and Montreal taking the third and fourth spots respectively. Edmonton and Quebec City tied for fifth and Calgary had the honour of finishing last”

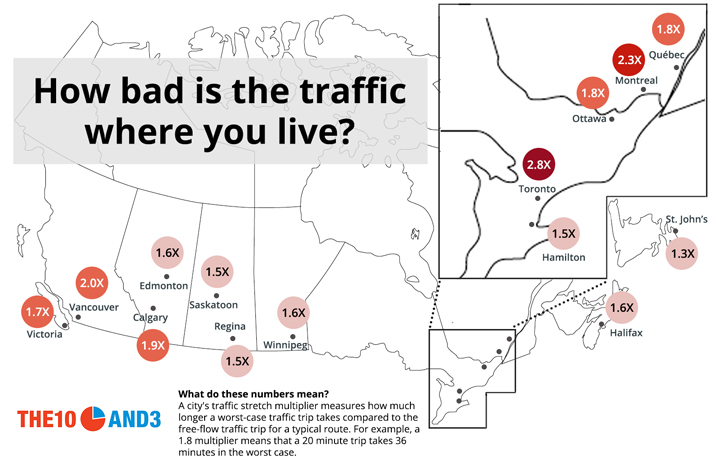
“Zack Gallinger and Arik Motskin studied how long it would take to travel a variety of routes in major Canadian cities during free-flowing traffic and during a worst-case scenario* traffic jam. They called the ratio between these two trip times the “traffic stretch multiplier. Unsurprisingly, Toronto tops the list with an average traffic stretch multiplier of 2.8. The problem, the study’s authors say, is the city’s highways are ill-equipped to deal with the population density of the surrounding communities.”

“While a trip downtown from dense residential areas like Markham in the north or Scarborough in the northeast could take under a half hour in free-flow traffic, commuters in peak traffic can expect a voyage of well over 75 minutes,”

“growing cities like Calgary and Ottawa are beginning to feel traffic pressure: certain routes within those cities can produce traffic stretch multipliers of 2 or more during worst-case scenarios.”

Tuesday, January 26, 2016

What are the Health Impacts of Low Concentrations of PM2.5?

Low-Concentration PM2.5 and Mortality: Estimating Acute and Chronic Effects in a Population-Based Study (7 page pdf, Liuhua Shi, Antonella Zanobetti, Itai Kloog, Brent A. Coull, Petros Koutrakis, Steven J. Melly, and Joel D. Schwart, Environmental Health Perspectives, Jan. 1, 2016)

 Today we review research into the mortality impact, resulting from exposures to low concentrations of PM2.5 on both the short and long term, among a large population cohort in New England over the age of 65. The question is whether concentrations below EPA standards (12 μg/m3 of annual average PM2.5, 35 μg/m3 daily) still present a risk of death. Results indicate that low concentrations present a risk that varies according to the sources and composition of the particles with may include secondary aerosols. A major conclusion with public health policy implications was that improving air quality even at low levels of PM2.5 can yield health benefits.

  low levels pm

 Key Quotes:

“Both short- and long-term exposures to fine particulate matter (≤ 2.5 μm; PM2.5) are associated with mortality. However, whether the associations exist at levels below the new U.S. Environmental Protection Agency (EPA) standards (12 μg/m3 of annual average PM2.5, 35 μg/m3 daily) is unclear”

“there is spatial variability in PM2.5 concentrations within cities that time series studies generally do not take into account, which can introduce exposure measurement error.. In general, existing study cohorts are not representative of the overall population.”

“the estimated percent change in all-cause mortality with 95% CIs for a 10-μg/m3 increase in both short- and long term PM2.5 in the restricted and full cohort. In the restricted population, we found an estimated 9.28% increase in mortality (95% CI: 0.76, 18.52%) for every 10-μg/m3 increase in long-term PM2.5 exposure. A 2.14% increase in mortality (95% CI: 1.34, 2.95%) was observed for every 10-μg/m3 increase in short term PM2.5 exposure.”

 “When we applied the predicted daily PM2.5 with 1-km spatial resolution from our novel hybrid models, we observed that both short- and long-term PM2.5 exposure were significantly associated with all-cause mortality among residents of New England ≥ 65 years of age,”

 “Our findings suggest a larger effect at low concentrations among those ≥ 65 years of age, which may also reflect particle composition. The sources and composition of the particles may differ between low-pollution days and high-pollution days, which are likely more affected by secondary aerosols.”

“Our findings show that both short- and long-term exposure to PM2.5 were associated with all-cause mortality, even for exposure levels not exceeding the newly revised U.S. EPA standards, suggesting that adverse health effects occur at low levels of fine particles.”

“improving the air quality at even lower levels of PM2.5 than presently allowed by the U.S. EPA standards can yield health benefits.”

Thursday, January 21, 2016

Why Do We Need to Monitor Water Vapour Globally?

The need for accurate long-term measurements of water vapor in the upper troposphere and lower stratosphere with global coverage (20 page pdf, Rolf Muller, Anne Kunz, Dale F. Hurst, Christian Rolf, Martina Kramer, and Martin Riese1, Earth's Future, Dec. 30, 20015)

Today we review a journal article calling for the establishment of a global network of upper air balloons to measure water vapour in the upper troposphere and lower stratosphere. Although water vapour is the most important greenhouse gas it unlike CO2 has a lifetime of only a week or so because of the evaporation/condensation hydrological cycle, compared to a century for CO2 to accumulate in the atmosphere. Despite this water vapour acts as a positive feedback when the air has a higher humidity leading to more convective precipitation as a result of the warming of the earth’s surface.

 The global measurement of water vapour on a routine and operational basis lags the networks established earlier for CO2 and Ozone. Ideally, a dedicated upper air balloon network is recommended, augmented by satellite sensors with 2 km resolution to estimate Atmospheric water vapour. Global Climate Observing System (GCOS) Reference Upper-Air Network (GRUAN) is such a network made up of 30-40 sites. Following through on this ask will be important when estimating future climate impacts resulting from warming due to carbon emissions.

 water vapour  

Key Quotes:

“water vapor is the most important greenhouse gas in the Earth’s atmosphere; it accounts for about half of the present day greenhouse effect and is the most important gaseous source of infrared opacity in the atmosphere.. In contrast to CO2, water vapor in the atmosphere can condense and precipitate; therefore water vapor concentrations in the atmosphere are determined by condensation”

 “Increasing atmospheric CO2 also causes changes in the tropospheric Hadley circulation, with implications for convective ascent, cloud patterns and thus the tropospheric humidity distribution, particularly in the tropics” “water vapor changes in the lower stratosphere have been identified as an important driver of decadal global surface climate change”

“The Global Climate Observing System (GCOS) Reference Upper-Air Network (GRUAN) is an initiative …making progress in establishing a global network of 30 to 40 measurement sites…GRUAN sites are required to perform a water vapor sounding with a balloon-borne frost point hygrometer at least once per month.”

 “It would be extremely valuable to augment the long-term balloon network with satellite sensors, providing high vertical resolution (better than ≈ 2 km) measurements of water vapor in the UTLS on a time scale of decades.”

“We suggest that a global, long-term balloon-borne measurement program for UTLS water vapor should be established. Stations should cover the entire globe with an optimized distribution of sites, the launching strategy should take into account the local meteorology, and the intercalibration of the different stations should be ensured.”

Tuesday, January 19, 2016

Is Geoengineering A Practical Way of Combating Global Warming?

Blocking the Sun Is No Plan B for Global Warming (David Biello, Scientific American , Dec. 9, 2016)

 Today we review an assessment of attempting to reduce global warming by directly reducing incoming sunlight for the entire globe by artificial means, known as geoengineering. In view of the failure of many countries to take action to mitigate climate change, the challenge to reduce carbon emissions has gone to the point (to reduce by 3%/yr or more) where many feel that taking direct action through geoengineering is the only solution. The author warns though that doing this may produce inadvertent disasterous results as well as giving relief to the very modest efforts currently being made to reduce CO2 emissions.

 solargraphic  

Key Quotes:

“Planet-wide geoengineering schemes might work—or backfire. Either way, there is no getting around the need to reduce CO2 in the atmosphere

Geoengineering is also part of the appeal of big physics, once reserved for hydrogen bombs and subatomic particles. Figuring out how droplets of sulfuric acid sprayed into the stratosphere might offset rising CO2 offers physicists a chance to have a literal global impact”

“The incredibly slow progress in combating climate change worldwide—the Paris talks are the 21st attempt to reach international agreements in the past 25 years—raises the appeal of the seemingly quick fix of seeding the sky.”

“geoengineering could have unintended consequences worse than climate change itself or end up exacerbating the underlying problem of too much CO2 by mistakenly taking the pressure off to reduce fossil fuel burning.”

“The secret to combating climate change is not some lever to tilt Earth's energy balance but rather to be flexible, to build a system of replaceable parts with as many mutually reinforcing connections as possible to fend off a single, catastrophic failure—in a word, resilience, like that of life itself on this planet and how biology and geology conspire to create the air.”

Thursday, January 14, 2016

Can Nuclear Power Meet the Challenges of Global CO2 Mitigation?

Potential for Worldwide Displacement of Fossil-Fuel Electricity by Nuclear Energy in Three Decades Based on Extrapolation of Regional Deployment Data (10 page pdf, Staffan A. Qvist, Barry W. Brook, PLoS One(Public Library of Science) , May 13, 2015)

Also discussed here: The World Really Could Go Nuclear Nothing but fear and capital stand in the way of a nuclear-powered future (David Biello, Scientific American, Sep. 14, 2015

Today we review an article that concludes that all carbon fuelled power plants worldwide can be replaced in a little over 30 years with modern nuclear power plants. All that is required is public acceptance, government will and investment in the technology, making use of the experience gained over the last 50 years, as demonstrated prominently by France and more recently by Sweden. The most vocal arguments from the lay pubic against nuclear power focus on the high costs but these are expected to drop significantly as Type 4 reactors are brought onstream which can recycle spent nuclear fuel and uranium and use this as a resource. The International Atomic Energy Agency (IAEA) expects nuclear power to expand worldwide by 2030 as more reactors are built in Asia and the Middle East.

 nuclear option  

Key Quotes:

“In just two decades Sweden went from burning oil for generating electricity to fissioning uranium. And if the world as a whole were to follow that example, all fossil fuel–fired power plants could be replaced with nuclear facilities in a little over 30 years”

“Between 1960 and 1990 Sweden more than doubled its inflation-adjusted gross domestic product (GDP) per capita while reducing its per capita CO2emissions through a rapid expansion of nuclear power production….By 1986, with the addition of 11 more reactors, half of Sweden's electricity came from nuclear power and carbon dioxide emissions per Swede had dropped by 75 percent compared to the peak in 1970.”

"The mantra 'nuclear can't be done quickly enough to tackle climate change' is one of the most pervasive in the debate today and mostly just taken as true, while the data prove the exact opposite." “from the experience of Sweden and France and scaled up to the globe, a best-case scenario for conversion to 100 percent nuclear power could enable the world to stop burning fossil fuels and start fissioning uranium for electricity within 34 years.”

“while the cost of construction is currently stable or falling in these countries, a global expansion of nuclear power would mean increased operating costs as the price of uranium ore and fuel is driven up, at least until generation IV reactors that use recycled spent nuclear fuel and depleted uranium or thorium as their input, become widespread and economically competitive”

"The International Atomic Energy Agency (IAEA) does expect nuclear power to expand worldwide by 2030 as more reactors are built in Asia and the Middle East—and use of nuclear could grow as much as 68 percent by then if all proposed reactors were built.”

“Even role model Sweden is mulling over retiring its reactors, having already shut down the two at Barseback early. As a result, an additional hundreds of millions of metric tons of CO2 are being dumped into Earth’s atmosphere, as more fossil fuels are burned to replace that lost nuclear power”

“No renewable energy technology or energy efficiency approach has ever been implemented on a scale or pace which has resulted in the magnitude of reductions in CO2 -emissions that is strictly required and implied in any climate change mitigation study—neither locally nor globally, normalized by population or GDP or any other normalization parameter.”

Tuesday, January 12, 2016

What are the Public Health Considerations when Mitigating Climate Change in Cities?

Building-related health impacts in European and Chinese cities: a scalable assessment method (13 page pdf, Jouni T. Tuomisto, Marjo Niittynen, Erkki Pärjälä, Arja Asikainen, Laura Perez, Stephan Trüeb, Matti Jantunen, Nino Künzli and Clive E. Sabel , Environmental Health, Dec. 14, 2015)

Today we review an assessment of the impact of various climate mitigation changes on health, an aspect not often considered in trying to achieve the main objective of reduced carbon emissions by reducing energy requirements for buildings for example.. In the European cities examined the health benefits were minimal (but positive) largely because the existing power sources were already clean. Care needs to be taken when reducing heating needs by adding insulation which may cause a worsening of indoor air quality. The advantages of having such a model are clear as more cities undertake mitigation by redesigning buildings.

 building and health  

Key Quotes:

“Active climate mitigation policies will also, aside of their long term global impacts, have short term local impacts, both positive and negative, on public health.”

“Our main objective was to develop a generic open impact model to estimate health impacts of emissions due to heat and power consumption of buildings.”

“The assessed policies were replacement of peat with wood chips in co-generation of district heat and power, and improved energy efficiency of buildings achieved by renovations”

“Kuopio has a climate objective to reduce GHG emissions by 40 % between 1990 and 2020. This is a major challenge but it seems to be achievable if large fuel changes from peat to wood-based fuels are done in the district heating.”

“levels of indoor pollutants are affected by ventilation and there is a risk that energy savings by decreasing ventilation may cause higher exposures and increase harmful health effects.”

 “The main study areas included heat and power generation, traffic, buildings and their effect on health and well-being.”

“The assessed local public health benefits of the fuel change and energy conservation – buildings renovation – policies, compared to the BAU, are 9 disability-adjusted life years (DALY) per year in Kuopio and 15 DALY/year in Basel in 2030”

“Stuttgart demonstrated that small scale wood pellet combustion for residential heating generates only 1 % of the required heat, but from 2010 to 2025 the burden of disease could be decreased via its banning in the city centre by 15 DALY/year or be increased by its current growing trend by 200 DALY/year.”

“In the assessed cases, all considered decision options had minimal health impacts of PM2 emissions as the current district heating systems are already clean.”

Thursday, January 7, 2016

How Does Outdoor Air Pollution Affect the Health of your Brain?

The central nervous system (2) is a combinatio...
The central nervous system (2) is a combination of the brain (1) and the spinal cord (3). (Photo credit: Wikipedia)
The Outdoor Air Pollution and Brain Health Workshop (27 page pdf, Michelle L. Block, Alison Elder, Rick L. Auten, Staci D. Bilbo, Honglei Chen, Jiu-Chiuan Chen, Deborah A. Cory-Slechta, Daniel Costa, David Diaz-Sanchez, David C.Dorman, Diane Gold, Kimberly Gray, Hueiwang Anna Jeng, Joel D. Kaufman,Michael T. Kleinman, Annette Kirshner, Cindy Lawler, David S. Miller, Sri Nadadur, Beate Ritz, Erin O. Semmens, Leonardo H. Tonelli, Bellina Veronesi, Robert O. Wright, and Rosalind Wright, Neurotoxicology, Oct, 1, 2013)

Today we review the observations and conclusions from a workshop on the Impacts of Outdoor Air Pollution on Brain Health in 2012. Air pollution has been thought to have impacts on the central nervous system (CNS) resulting in brain inflammations, autism, lower IQ in children and Parkinson’s and Alzheimer’s diseases among others. Many neurogenerative diseases are associated with cumulative lifetime exposure resulting in premature aging. Research is called for which evaluates whether CNS disorders follow as a result of cardiovascular diseases or are independent of them

Key Quotes:

“toxicology studies have raised concerns about the potential impact of air pollution on central nervous system (CNS) outcomes including chronic brain inflammation, microglia activation, and white matter abnormalities leading to increased risk for autism spectrum disorders, lower IQ in children, neurodegenerative diseases (Parkinson’s disease, PD; Alzheimer’s disease, AD), multiple sclerosis, and stroke”

“Alterations in the CNS may have direct health consequences or play a secondary role (s) by modulating the responses of the cardiovascular, pulmonary and immune systems. Conversely, alterations in the cardiovascular, pulmonary and immune systems due to air pollution may have effects on the brain due to the production of circulating proinflammatory mediators.”

 “Many neurodegenerative diseases are predicted to be the result of cumulative exposures across an entire lifetime (Carvey et al. , 2006) and aging is a well-known risk factor for the two most prevalent neurodegenerative diseases, AD and PD[Parkinson’s disease, PD; Alzheimer’s disease, AD]”

“Specific human research priorities are to:
 1. Explore the effect of specific air pollution components on increased risk for neurodevelopmental disorders (e.g. autism), neurodegenerative disease (e.g. AD and PD), and mental disorders (e.g. depression) in humans.
2. Evaluate whether observed CNS effects occur downstream or independent of cardiovascular effects or cerebrovascular damage. It will be particularly useful to examine air pollutant effects in adult cohorts that are well-characterized with respect to subclinical and clinical cardiovascular and cerebrovascular disease endpoints prior to or concurrently with the assessment of brain health.
3. Utilize refined exposure estimates to examine long-term air pollution effects on the brain over the life course…, adding an air pollution exposure assessment component to existing, ongoing populations with available information on residential history or extending the scope of outcome assessment in specific longitudinal air pollution cohort studies”

“Evidence is accumulating for air pollution related CNS effects at multiple levels, including modulation of molecular/neuochemical/pathobiological pathways, neuroinflammation, neurotoxicity, and neurobehavioral changes that implicate subclinical/clinical manifestation of disease.”

Tuesday, January 5, 2016

Mapping Methane, the Greenhouse Gas

Making methane visible (Abstract, Magnus Gålfalk, Göran Olofsson, Patrick Crill & David Bastviken, Nature Cliate Change, Nov. 30, 2015)

Also discussed here: Advanced new camera can measure greenhouse gases (Science Daily, Nov. 30, 2015)

Today we review research from Sweden aimed at detecting methane, a highly radiative and invisible greenhouse gas, whose importance is being heightened by fracking natural gas in North America and elsewhere and the difficulty in measuring and monitoring it as part of climate change mitigation and action plans. The application of the new method uses a camera to record a high resolution spectrum and selects the methane contribution. This may be applied to sewage sludge deposits, combustion processes, animal husbandry and lakes as well as the vast areas of bogs and marshes that make up northern Canada and Russia. The present study used a camera on the ground but plans are to make it airborne for larger scale methane mapping.

  detecting methane  

Key Quotes:

Methane (CH4) is one of the most important greenhouse gases, and an important energy carrier in biogas and natural gas.”

“There are several questions surrounding the powerful greenhouse gas methane. Its rapid but irregular increase in the atmosphere has puzzled researchers. And there is a high degree of uncertainty with regard to the sources and sinks of methane in the landscape”

“Here we show that CH4 gradients can be imaged on the <m2 scale at ambient levels (~1.8 ppm) and filmed using optimized infrared (IR) hyperspectral imaging.”

“The camera can be used to measure emissions from many environments including sewage sludge deposits, combustion processes, animal husbandry and lakes. For each pixel in the image the camera records a high-resolution spectrum, which makes it possible to quantify the methane separately from the other gases”

"This gives us new possibilities for mapping and monitoring methane sources and sinks, and it will help us understand how methane emissions are regulated and how we can reduce emissions. So far the camera has been used from the ground and now we're working to make it airborn for more large-scale methane mapping,"