Thursday, August 28, 2014

How does demand pricing of carbon work in British Columbia?

HACKING THE CLIMATE - B.C. put a price on carbon. What happened next will surprise you (Keleigh Annau, Sustainable Prosperity, Jun. 30, 2014)

Also discussed here: How the Carbon Tax Works (B.C. Ministry of Finance)

Today we review discussions about why and how a carbon tax was implemented in Canada’s most western province which has resulted in its greenhouse gas emissions being 20% lower than the rest of the country – and to almost everyone’s surprise, a public that demands that it continues. A key part of the approach is the return of revenue generated either by direct payments to those on low or zero income or by tax deductions to the middle class- a return of $500 million more each year than what was taxed for the province. Those who have adapted to the higher prices benefit the most in terms of money returned. By 2020, it is estimated that the emissions avoided are equivalent to those from nearly 800,000 cars each year. By comparison the reductions credited to technological approaches such as electric light rail transit are puny- example in the city of Ottawa that a 43 km LRT system proposed in 2008 would have taken only 2, 400 cars off the road each year (and cost taxpayers nearly a billion dollars). Such a reduction in CO2 also has significant benefits in terms of lower health costs from the reduction of other toxic pollutants emitted by cars.

 gas pump 

Key Quotes:

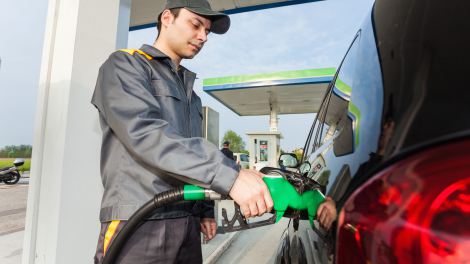
“The B.C. carbon tax is built on a simple tenet of human behavior: When the price of something goes up, people will consume less of it. It actually applies to not just gasoline, but to all sources of atmospheric carbon, including natural gas and propane, and is based on how much carbon they emit.”

British Columbia’s per capita greenhouse gas emissions are now nearly 20 percent below the rest of Canada’s. This put the province “within spitting distance” of its goal to reduce emissions 6 percent below 2007 levels by 2012 a year ahead of schedule,”

“the carbon tax alone could cause a reduction in B.C.’s emissions in 2020 by up to three million tonnes of CO2 equivalent annually. This is roughly the equivalent to the greenhouse gas emissions created by 787,000 cars per year”

“While the levy is the highest of its kind in the world, the regional economy has still continued to grow on pace with, and in the last couple of years slightly faster than, the rest of the country.”

“the money collected goes right back to the taxpayers in the form of lowered income taxes or checks… If you earn less than $29,300 annually, and wouldn’t benefit from a tax credit, you get a check four times a year…totaling $105 a year”

“People in the next two tax brackets, earning up to $111,300 a year, receive a rebate on their income taxes. As a result, middle class families, which make up about 60 percent of the population, enjoy the lowest income taxes in the country”

 “Since it was first introduced in 2008, the carbon tax has returned $500 million more to taxpayers in tax reductions than it has raised in revenue.”

“The most efficient way to address greenhouse gases is to do what any economist will tell you..Put a price on them.”

“The leadership of one Canadian province, and now western American states, is sending the message that if national governments won’t commit to building a sustainable future, smaller governments will take matters into their own hands.”

Tuesday, August 26, 2014

How Bad is the Air Quality from LNG facilities at Kitimat, the end of the pipeline?

Kitimat Airshed Emissions Effects Assessment(363 page pdf, Julian Aherne, Susan Barnes, Beth Beaudry, Simon Casley, Hui Cheng, Alexander Hall, Anna Henolson, Daniel Krewski, John Laurence, David Marmorek, Carol Murray, Greg Paoli, Shaun Watmough, prepared by ESSA Technologies Ltd. for British Columbia Ministry of Environment, Apr. 25, 2014)

Also discussed here: New airshed study is a “nail in the coffin” for government LNG dreams in Kitimat(Andrew Weaver, Jul. 18, 2014)

Today we review an environmental impact assessment report prepared for the British Columbian government in anticipation of developments associated with Liquid Natural Gas Terminals that could affect human health and the environment. The developments include an existing aluminum smelter, four proposed LNG terminals, a proposed oil refinery, and gas turbine powered electrical generation facilities, as well as related marine transportation sources. The assessment used a colour-coded system for impacts of air pollution on human health ranging from green for “clean environment” though yellow and orange to red for values that breach the US EPA National Ambient Air Quality Standards. Similarly for natural environmental impacts on vegetation, lakes and soil they range from green for negligible impact through to red where the impact is considered to be “extremely unacceptable”.

The results indicate a red for human health for hourly SO2 and a red for aquatic ecosystems. In the words of Dr. Andrew Weaver, the only member of the provincial parliament with an advanced degree in environmental science, in addition to be a world leader in climate science and modeling “The study undeniably concludes that if you put four LNG plants into Kitimat you will have critical impacts on human health.”. Nothing more needs to be said …. except STOP. kitimat cove 

Key Quotes:

“Kitimat’s location at the head of Douglas Channel in northwestern British Columbia (BC) makes it an attractive location for industries seeking a marine terminal along BC’s Pacific Coast in order to access foreign markets. Numerous liquefied natural gas (LNG) facilities as well as an oil refinery and a crude oil export terminal have been proposed for the Kitimat area, which is placing new and urgent demands upon regulatory decision-making processes.”

“The industrial facilities explored in the assessment included an existing aluminum smelter, four proposed LNG terminals, a proposed oil refinery, and gas turbine powered electrical generation facilities, as well as related marine transportation sources.”

“Annual SO2 and NO2 averages: In the Service Centre, the values span the Yellow and Orange category.”

“Hourly SO2 averages: The three Near locations had SO2 maximum 99th percentile values within the Red category for Scenarios A_28.2 through Is/Im_83.3,”

“Hourly NO2 averages: Two different background levels were compared. Using the Quesnel background level, the three Near locations had maximum 98th percentile values categorized as Orange”

“The study undeniably concludes that if you put four LNG plants into Kitimat you will have critical impacts on human health.”

“even under the best case scenario with no oil refinery and with full treatment of Rio Tinto Alcan smelter emissions, four new LNG plants will raise sulphur dioxide levels to the point of causing “critical” risk to human health. Those plants will also increase nitrogen dioxide levels to the point of causing “high” risk to human health.”

Thursday, August 21, 2014

How Does Air Pollution Affect Natural Ecosystems?

Effects of air pollution on European ecosystems- Past and future exposure of European freshwater and terrestrial habitats to acidifying and eutrophying air pollutants (42 page pdf, European Environment Agency, Jun. 30, 2014)

Also discussed here: Effects of air pollution on European ecosystems (Diego Fdez-Sevilla, Press release, European Environment Agency technical report, Jun. 30, 2014)

Today we review a report describing progress made by European countries in reducing air pollution from burning vehicle emissions and the use of agricultural fertilizers over the last decade or two, with respect to the impact it has on the natural environment which is impacted when critical thresholds or loadings are exceeded. While action on acid rain has almost eliminated the SO2 acidification impacts, eutrophication continues to be a problem in southeast-central Europe where fish and flowering plants are impacted. More than 50% of the ecological systems will still be at risk of excessive nutrient N deposition in 2020.


ecology and air pollution  

Key Quotes:

 “ This report focuses on the deposition of airborne sulphur (S) and nitrogen (N) compounds and their negative effects on ecosystems. N- and S-containing air pollutants are released to the atmosphere by combustion processes such as the burning of coal or petrol, and by non-combustion processes such as agricultural fertiliser application”

“an ecosystem is at risk of acidification or eutrophication when its critical load is exceeded by acidifying and eutrophying air pollutants, respectively. When critical loads are exceeded the actual damage to sensitive elements of an ecosystem may involve a time delay, dependent on soil, water and vegetation properties as well as combined effects due to for example climate change” 

“Although air pollution does not cause as much harm as it once did, we are still struggling to protect sensitive ecosystems from harmful effects such as eutrophication. This changes habitats, endangering a wide range of species from fish to flowering plants. It is particularly striking that the problem appears to be just as bad in Europe’s protected natural areas.”

“As SO2 emissions have fallen, the relative contribution made by ammonia (NH3) emitted from agricultural activities and nitrogen oxides (NOX) emitted from combustion processes to surface water and soil acidification has increased or even become predominant in some regions in Europe. NH3 and NOX are also eutrophying air pollutants.”

“When implementing current legislation, more than 50 % of the ecosystem areas classified according to the EUNIS habitats classification are expected to be still at risk of excessive nutrient N deposition in 2020.”

Tuesday, August 19, 2014

When Do you Become “Old”

Population ageing: the timebomb that isn’t? (5 page pdf, Jeroen Spijker and John MacInnes, BMJ(British Medical Journal), Nov. 12, 2013)

Today we review a paper about aging and the implications of using a fixed age, such as 65, to indicate when to worry about “old age” diseases, particularly those such as heart and lung diseases that are aggravated by air pollution. The authors contend that the important statistic to use is the years of remaining life expectancy when the average life expectancy in the UK has increased by 34 years, thus moving the yard stick from the pension age of 65 to later. Over time improvements in medical technology and, indirectly in air quality in some places, seniors are living longer which has increased the size of the older generation, while growing obesity has resulted in earlier occurrence of diabetes with negative impacts on life expectancy. It is clear that the dynamics that affect health of the elderly has changed.

old age dependency   

Key Quotes:

“For the first time, there are now more people over the age of 65 in the United Kingdom than there are children under 15 years. Over the past century, the proportion of over 65s has grown from about one in 20 to around one in six.”

“the old age dependency ratio. It takes the number of people who have reached the state pension age and divides it by the number of working age (16-64 years) adults in order to estimate the proportion of older people relative to those who pay for them.”

 “Since the main factor behind the ageing population is increasing life expectancy, age is a poor measure of its burden…We can best capture this changing importance of age by realising that the age of a population comprises two components: the years lived of its members (their ages) and their years left (remaining life expectancies).”

“In aggregate terms, the population of 2009, despite being much older as measured by years lived, was nevertheless younger than that of 1900 in terms of years left.[39 more years]”

“if we define the dependent older population as people with a remaining life expectancy of ≤15 years, the trend is different…from the late 1970s improvements in old age mortality have reversed the rise in the proportion of the population with low life expectancies.”

“We should not assume that population ageing itself will strain health and social care systems. Demand for services will rise but continue to be driven by other factors, chiefly progress in medical knowledge and technology, but also the increasing complexity of comorbid age related conditions.”

 “Ageing related diseases like osteoarthritis are predicted to increase and start at a younger age. This may not only result in an increased risk of cardiovascular and other chronic diseases, it also suggests that the ageing process can speed up as well as slow down, with obvious implications for public health policy.

Thursday, August 14, 2014

Reporting Local Industrial Air Pollution in Canada’s Largest City

Tracking and Reducing Chemicals in Toronto: Third Annual ChemTRAC Report (David McKeown, Medical Officer of Health, Toronto Board of Health, Jun. 13, 2014)

Also discussed here : ChemTRAC – Improving Toronto's Air: 2014 Annual Report (David McKeown, Medical Officer of Health, Toronto Board of Health, Jun. 13, 2014)

And here: Toronto Public Health Reveals Local Air Pollution Sources (Jennifer Kalnins Temple, Envirolaw, Jul. 10, 2014)

Today we review the third annual report from Toronto’s Medical Officer of Health on the monitoring of local industrial air pollutants, a program (ChemTRAC) that requires local industries to emissions of 25 specific pollutants- the top three of which are VOCs, NOx and PM2.5. The Health Board estimates that of the 1300 deaths caused by air pollution each year, local industry is responsible for 120, in addition to 200 hospitalizations. This not only underlines the importance of the program but also allows for identification of sources of health risks not previously defined- the mercury releases from incineration of human remains at crematoria for example- and allows companies to take measure to reduce the release of critical pollutants. A large majority (90%) of the reporting companies found the ChemTRAC program helpful and 2/3s found that the program helped them to reduce harmful emissions The only question one might ask- why is this not required in other cities, especially large ones with industrial pollution within their boundaries?

 map of toronto air poll sources 

Key Quotes :

 “ChemTRAC provides more information on releases of highly toxic substances in comparison to existing programs, like NPRI. Last year, ChemTRAC data was accessed almost 10,000 times online, making it one of the top downloaded datasets from Toronto’s Open Data site. This information provides the public with valuable insights on key chemicals in their community and will help Toronto Public Health design better initiatives to improve Toronto’s air.”

“The ChemTRAC program..three key elements:
1) the Environmental Reporting and Disclosure Bylaw …requires businesses to report on their use and release of 25 priority substances ..;
2) a public disclosure system to inform the public about facilities in their neighbourhoods;
and 3) supports for businesses to reduce their use and release of the priority substances. “

“Toronto Public Health estimates that air pollution currently gives rise to 1300 premature deaths and 3550 hospitalizations in our city each year. Of those, pollution from local industries is responsible for about 120 of these deaths and 200 of these hospitalizations.”

“In its 2014 air pollution burden of illness update, ..pollutants emitted within Toronto’s borders contribute to 670 deaths and 1,970 hospitalizations, with local industries contributing about 18 percent of these deaths and 10 percent of these hospitalizations.”

“90 percent of businesses that used ChemTRAC support services found them helpful or very helpful…Sixty-four per cent of businesses surveyed in 2013 indicated that the ChemTRAC program has made them more aware of the measures they can take to reduce the release of use of priority substances. ”

“the 2013 ChemTRAC annual report identified mercury as a substance of high concern and crematoria as a major source of releases to air.”

Tuesday, August 12, 2014

Recommendations to Counter Climate Change by 2050

Per capita anthropogenic greenhouse gas emissi...
Per capita anthropogenic greenhouse gas emissions by country for the year 2000 including land-use change. (Photo credit: Wikipedia)
Pathways To Deep Decarbonization - interim 2014 report to the Secretary General of the United Nations (288 page pdf, Jeffrey Sachs, Laurence Tubiana, Emmanuel Guerin, Henri Waisman, Carl Mas, Michel Colombier, Guido Schmidt-Traub, Sustainable Development Solutions Network (SDSN), Jul. 8, 2014) 

Also discussed here: Executive Summary - Pathways To Deep Decarbonization (16 page pdf, Sustainable Development Solutions Network (SDSN), Jul.8, 2014) 


And here: Deep Decarbonization Pathways (Sustainable Development Solutions Network) 

Today we review an interim report to the UN’s Secretary General that puts to one side the last 20 years of largely failed negotiations focused on legal niceties by 20 conferences, sponsored by the UN Convention on Climate Change, aimed at reducing the impact of climate change by reducing greenhouse gas emissions and by making communities more resilient. The report estimates that without significant changes to the way that energy is generated from carbon fuels that the global mean temperature will increase by 4.5 deg C by the end of the century. It recommends three approaches be taken quickly and seriously by all countries, but especially those among the largest emitters (America, Australia, Brazil, Britain, Canada, China, France, Germany, India, Indonesia, Japan, Mexico, Russia, South Africa, and South Korea) and these are: Energy efficiency and conservation, Low-carbon electricity and Fuel Switching. A final report is expected within the next year leading up to a crucial climate conference in Paris in 2015. 

Key Quotes: 

“All we have been doing in these negotiations for all these years is talking about things in the abstract. It’s not producing the deep technological changes that can get us to a low-carbon global economy,” 

“in the absence of additional commitments to reduce GHG emissions, the world is on a trajectory to an increase in global mean temperature of 3.7°C to 4.8°C compared to pre-industrial levels. When accounting for full climate uncertainty, this range extends from 2.5°C to 7.8°C by the end of the century. “ 

 “the level of cumulative CO2 emissions from land use, fossil fuels, and industry must be in the range of 550-1300 billion tons (Gigatons or Gt) by mid-century. If one excludes a significant contribution from net negative emissions,3 the CO2 budget to 2050 is 825 Gt. Staying within this CO2 budget requires very near-term peaking and a sharp reduction in CO2 emissions thereafter, especially in energy-related CO2 emissions.” 

“Assuming a world population of 9.5 billion people by 2050… means that countries would need to converge close to a global average of CO2-energy emissions per capita of 1.6 tons in 2050, which is a sharp decrease compared to today's global average of 5.2 tons, especially for developed countries with current emissions per capita much higher than today's global average.”  

“The study looks at the world’s 15 biggest economies: America, Australia, Brazil, Britain, Canada, China, France, Germany, India, Indonesia, Japan, Mexico, Russia, South Africa, and South Korea, which between them account for 70% of global emissions.” 

 “The 15 DDPs…share three common pillars of deep decarbonization of national energy systems:  

1) Energy efficiency and conservation: Greatly improved energy efficiency in all energy end-use sectors including passenger and goods transportation, through improved vehicle technologies, smart urban design, and optimized value chains; residential and commercial buildings, through improved end-use equipment, architectural design, building practices, and construction materials; and industry, through improved equipment, production processes, material efficiency, and re-use of waste heat. 

2) Low-carbon electricity: Decarbonization of electricity generation through the replacement of existing fossil-fuel-based generation with renewable energy … 

3) Fuel Switching: Switching end-use energy supplies from highly carbon-intensive fossil fuels in transportation, buildings, and industry to lower carbon fuels… 

 “The report envisages that Britain by mid-century would generate about 35% of its electricity from nuclear power plants and 40% from coal using carbon capture technologies… America too will remain heavily invested in coal, and could generate up to 35% of its electricity from coal using carbon capture technologies.South Africa, which is now heavily dependent on coal, could generate 80% of its electricity from solar energy, while countries such as Australia could achieve cuts in their emissions by switching to electric cars and public transport.”