Friday, August 30, 2013

What are British Cities Doing to Cope with and Reduce the Impacts of Climate Change?

English: The City of London skyline as viewed ...
English: The City of London skyline as viewed toward the north-west from the top floor viewing platform of London City Hall on the southern side of the Thames. In the foreground: Dixie Queen and Millennium Time at Tower Millennium Pier. This is a 5 segment panoramic image taken by myself with a Canon 5D and 24-105mm f/4L IS lens. (Photo credit: Wikipedia)

  Assessment of the climate preparedness of 30 urban areas in the UK(Abstract, Oliver Heidrich, Richard J. Dawson, Diana Reckien, Claire L. Walsh, Climae Change, July 2013)  

Also quoted here: Planning by Postcode: How Prepared Are Cities for Climate Change?(Science News, Aug. 12, 2013) 

Today we review a research report on the state of climate change planning by 30 cities in the UK. Results indicated more progress than in many American or Canadian cities with a consensus on the threat and almost all had a strategy to deal with it and had set targets to reduce carbon emissions. Where there were differences lay in the definition of specific targets and time frames. The country’s capital, London, to little surprise from those who follow urban planning for climate change, had the most advanced plans with progress on the use of renewable energy and waste management.

Key Quotes:

“The 30 cities chosen for the study [representing ~28 % of the UK’s population] were those selected as part of the European Urban Audit database”

" all of them acknowledged that climate change was a threat and all except two had a strategy or policy in place to reduce emissions and also adapt to cope better with future weather patterns, in particular flooding,"

" a plan is only any good if you implement it and then assess it to see how effective it has been, this requires a long term investment in the strategies…in many cities this wasn't happening.. very often, no-one was monitoring to see whether it made a difference or had actually made things worse.”

“London was found to have one of the most advanced strategies in place, mitigating the impact on climate change through, for example, energy efficiency and saving, increasing the use of renewables, waste management and the introduction of greener modes of transport.”

“Almost all cities had set targets for reducing CO2 emissions although quite a few would not commit to an actual target, figure or timescale, rendering them meaningless.. Emissions reduction targets ranged from 10 %–80 % with differing baselines, timeframes and scopes, for defining and meeting these targets”

"What this research highlights more than anything is the huge variations in the state of readiness for climate change across the UK, and the method of assessing the preparedness of cities can easily be applied to cities in other countries.”


Enhanced by Zemanta

Wednesday, August 28, 2013

Where Does China’s Air Pollution Come From?

Source Forensics of Black Carbon Aerosols from China(Abstract, Bing Chen, August Andersson , Meehye Lee, Elena N. Kirillova , Qianfen Xiao , Martin Kruså, Meinan Shi , Ke Hu , Zifeng Lu , David G. Streets , Ke Du, and Örjan Gustafsson, Environmental Science and Technology, Jul. 11, 2013)

Also discussed here: Researchers Constrain the Sources of Climate and Health-Afflicting Air Pollution from China(Science Daily, Aug. 8, 2013)

Today we review research on the top sources of air pollution and greenhouse gas emissions in the country considered by many to be the most polluted in the world. Results indicate that this is not emissions of Black Carbon from cooking food in homes and restaurants- so-called biomass sources- but from the burning of coal in cities and from vehicle emissions in traffic. This will allow authorities to plan for efficient mitigation of climate change because Black Carbon has a shorter lifetime in the atmosphere (days, weeks) than other greenhouse gases, such as CO2 (decades, centuries).

china soot

Key Quotes:

“the brown cloud soot was persistently about four-fifths from fossil fuel combustion (C-14 "dead") and only one-fifth from burning of contemporary biomass (C-14 "alive").”

“Globally, soot accounts for roughly half the warming potential of carbon dioxide”

“while carbon dioxide is the key target for fighting climate change, its levels in the atmosphere respond on a sluggish 100-1000 yr timescale to reductions in emissions. ..In contrast, Brown Cloud soot particles only reside in the atmosphere for days-weeks raising the hope for a rapid response of the climate system"

“The relative contribution from fossil fuel versus biomass combustion is important to constrain as fossil soot is a stronger climate forcer, penetrates deeper into the respiratory tract and accurate source apportionment is the underpinning of society's mitigation actions.”

“Severe air pollution, covering large parts of South and East Asia as Atmospheric Brown Clouds (ABC), originate from incomplete combustion such as household burning of coal and wood fuel, agricultural residue burning, industrial processes and massive traffic.”

“To mitigate near-term climate effects and improve air quality in East Asia, activities such as residential coal combustion and city traffic should be targeted.”
Enhanced by Zemanta

Monday, August 26, 2013

Real-time Personal Air Pollution Monitor


Also discussed here: (7 min video)  

And here: My Air, My Health Challenge(U.S. Environmental Protection Agency and U.S. Department of Health and Human Service)

Today we review a report on an air quality monitor that can be worn around the neck, showing the state of air pollution which the wearer is exposed to during a day, taking into account breathing frequency and relative pollutant concentration, shown on a real-time electronic display- all for a cost estimated at around $150. The invention recently won top prize from the “My Air, My Health Challenge“, conducted by the U.S. Environmental Protection Agency and U.S. Department of Health and Human Service.

Aq sensor  

Key Quotes:

“Integrating sensors for multiple airborne pollutants with sensors for heart rate, breathing rate, and physical activity into fitness clothing for athletes”

“..is an integrated device that combines data on air quality with information about your breathing to calculate what particulates you’re taking in”

“Dockterman hopes it will have a price tag similar to the Nike+FuelBand", which goes for about $150.”

“Key to the device is a stretchy band called a "groove strip" that goes around the chest. One side is made of nylon and lycra; the other is a knitted silver "matrix." The device can tell how deeply you’re breathing in and out based on the tautness of the band. The system combines this information with data from an air sensor, which sends a reading via "Bluetooth" to a mobile device
Enhanced by Zemanta

Friday, August 23, 2013

Filling Gaps in Lifetime Exposure to Air Pollution

Imputation method for lifetime exposure assessment in air pollution epidemiologic studies (28 page pdf, Jan Beyea, Steven D Stellman, Susan Teitelbaum, Irina Mordukhovich, Marilie D Gammon, Environmental Health, Aug. 7, 2013)

Today we review several techniques aimed at filling gaps in the environmental record, especially those which are important because of the health impacts that may occur early (or late) in life or by proximity to higher pollution exposure. Examples include use of meteorological diffusion modeling applied to road segments and intersections and the use of surrogate doses which otherwise could be hidden or masked when applying the existing monitoring record with data gaps. relative concentration  

Key Quotes:

 “we wanted to add individualized inhalation exposures of PAH from traffic emissions to a previously collected set of individualized PAH exposures from diet and active/passive smoking.”

 “The contribution from each road segment to the air concentration at a downwind receptor residence was computed within 100 meters of a road using a highway line-source model applied to each of the 500,000, straight-line road segments in the traffic network…A key result was higher than average emissions coming from traffic intersections, which were modeled separately”

 “Our finding of a consistent, strongly right-skewed distribution of traffic doses, associated with heavily trafficked intersections, means that non-standard distributions of exposure must be anticipated in studying traffic emissions.”

 “The past decade has seen an increasing understanding of the importance of the impact on chronic disease risk of exposures at all stages of life, especially exposures occurring during the early years of life when many organs are still undergoing rapid and formative growth”
Enhanced by Zemanta

Wednesday, August 21, 2013

How Does Urban Sprawl Impact the Environment?

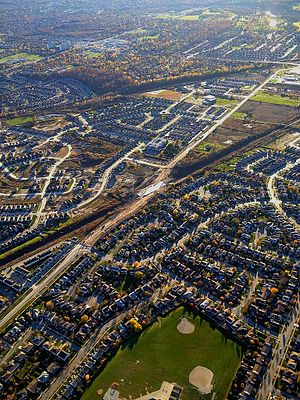
English: Urban Sprawl in London, Ontario
English: Urban Sprawl in London, Ontario (Photo credit: Wikipedia)
The Environmental Impacts of Sprawl: Emergent Themes from the Past Decade of Planning Research(26 page pdf, Bev Wilson and Arnab Chakraborty, Sustainability, Aug. 5, 2013)

Today we review a literature review of articles that examine the meaning of urban sprawl globally, its impacts on air, water, land and energy, how it relates to justice and equity and how different countries either encourage or discourage its growth. The authors point out that, although sprawl has no widely accepted definition, improvement comes when it is viewed within the context of urban sustainability rather than narrowly as a geographic metric.

Key Quotes:

“At its core, urban sprawl is a complex and multifaceted phenomenon with no universally accepted definition.. In the Western context the term typically evokes images of low density, automobile dependent, and largely monotonous residential development along the periphery of an urban area”

“compact development can significantly reduce pollutant emissions at the regional scale, but only over the long-term and when complemented with growth controls, disincentives for vehicle use, and technological emissions controls.”

“The consumption of fossil fuels is the largest contributor to CO2 emissions followed by land use change ..and these are the primary connections between urban sprawl and climate change observable in the planning literature.”

“Within the buildings sector, the connection between urban sprawl and climate change hinges on energy losses through transmission lines (i.e., longer distances spanned), larger heated areas on average, and increased surface temperatures by virtue of the heat island effect in areas with more sprawl”

“Conceptualising urban sprawl as a pattern of development unfolding over time that is incompatible with commonly accepted characteristics of sustainable development can potentially alleviate many of the difficulties that have plagued sprawl research”

“Economic and social dimensions of sustainable development are as important as environmental considerations and the true challenge for those who inhabit, manage, and study urban area is to somehow balance these three aspects.”
Enhanced by Zemanta

Monday, August 19, 2013

Fact Sheet Summary of Air Pollution Impacts on Health


Air Pollution(Environmental Protection Agency, USA)
Today we review a valuable reference from the EPA which summarizes the impacts air pollution has on human health (as well as the environment and climate), what are the main sources of this pollution (electric utilities, agriculture and highway vehicles) and trends in the monitoring of pollutants (on average, down 41 % from 1990 to 2008- a notable exception is ammonia which only dropped 3% in this period).
air pollution sources
Key Quotes :
“Health Impacts:
  • aggravation of respiratory and cardiovascular disease;
  • decreased lung function;
  • increased frequency and severity of respiratory symptoms such as difficulty breathing and coughing; (4) increased susceptibility to respiratory infections;
  • effects on the nervous system, including the brain, such as IQ loss and impacts on learning, death
“Ozone (O3): Decreases lung function and causes respiratory symptoms, such as coughing and shortness of breath; aggravates asthma and other lung diseases leading to increased medication use, hospital admissions, emergency department (ED) visits, and premature mortality”

Particulate Matter (PM): Short-term exposures can aggravate heart or lung diseases leading to symptoms, increased medication use, hospital admissions, ED visits, and premature mortality; long-term exposures can lead to the development of heart or lung disease and premature mortality.”

“Lead (Pb): Damages the developing nervous system, resulting in IQ loss and impacts on learning, memory, and behavior in children. Cardiovascular and renal effects in adults and early effects related to anemia.”

“Oxides of Sulfur (SOx): Aggravate asthma, leading to wheezing, chest tightness and shortness of breath, increased medication use, hospital admissions, and ED visits; very high levels can cause respiratory symptoms in people without lung disease.”

“Oxides of Nitrogen (NOx): Aggravate lung diseases leading to respiratory symptoms, hospital admissions, and ED visits; increase susceptibility to respiratory infection.”

“Carbon Monoxide (CO): Reduces the amount of oxygen reaching the body’s organs and tissues; aggravates heart disease, resulting in chest pain and other symptoms leading to hospital admissions and ED visits.”
“Ammonia (NH3): Contributes to particle formation with associated health effects.”

“Volatile Organic Compounds (VOCs): Some are toxic air pollutants that cause cancer and other serious health problems. Contribute to ozone formation with associated health effects.”

“Mercury (Hg): Causes liver, kidney, and brain damage and neurological and developmental damage.”

“Other Toxic Air Pollutants: Causes liver, kidney, and brain damage and neurological and developmental damage.”

…Electric utilities contribute about 70 percent of national SO2 emissions. Agricultural operations (other processes) contribute over 80 percent of national NH emissions. Almost 50 percent of the national VOC emissions originate from solvent use (other processes) and highway vehicles. Highway vehicles and non-road mobile sources together contribute approximately 80 percent of national CO emissions.” 

“The combined emissions of the six common pollutants and their precursors (PM and PM , SO , NO , VOCs, CO, and lead) dropped 41 percent 2.5 10 2 x on average since 1990”
Enhanced by Zemanta

Friday, August 16, 2013

Achieving a Low Carbon City in China

On Track to Become a Low Carbon Future City? First Findings of the Integrated Status Quo and Trends Assessment of the Pilot City of Wuxi in China(20 page pdf, Carmen Dienst, Clemens Schneider, Chun Xia, Mathieu Saurat, Thomas Fischer and Daniel Vallentin, Sustainability, Jul. 31, 2013)

Today we review a study that examined how the city of Wuxi intends to reduce its greenhouse gas emission intensity by 50% from a base year of 2005 to 2020. Emissions from this city of 6 million, if compared to emissions by countries world-wide, would rank as the 50th.   The majority of these emissions come from the combustion of coal to generate electricity for industry and transportation and this is where the focus for lower carbon emissions are to be made. The challenge for many other modern industrialized cities world-wide is to find ways to effectively change the way that they operate from a time when carbon energy was cheap and not seen as the cause of climate change.
 alow carbon emissions  

Key Quotes:

 “40% to 78% of global greenhouse gas emissions are estimated to originate in urban areas”

“This paper presents outcomes of the Sino-German Low Carbon Future Cities (LCFC) project…taking into account three project dimensions:
 greenhouse gas emissions and related mitigation potentials;
 vulnerability to climate change and adaptation options
  material and resource uses”

“The study focuses on two pilot regions—one in China (Wuxi) and one in Germany (Düsseldorf)”

“The GDP per capita of Wuxi is high, resulting in relatively low carbon intensity. However, its relative emissions, i.e., CO2 per capita, are very high compared to Chinese average….For 2020, the Wuxi government has committed itself to reduce the carbon intensity of the city’s economy by 50% compared to 2005.”

“The main source for Wuxi’s emissions is the combustion of raw coal, which is needed to meet the high demand for energy. Electricity and heat production are main sources of emissions, representing more than half of the current carbon dioxide emissions

“The enormous increase of road transport, its related emissions, air pollution and future infrastructure challenges, makes it a key sector to be considered for Wuxi’s intended low carbon future development.”

“In the future, the temperatures are projected to further increase in each month at least until 2099, whereas the increase in summer is lower than during winter. Heavy and very heavy rain days are projected to increase non-significantly.”

 “Direct per capita CO2 emissions in Wuxi were 9.7 tons per capita in 2005, which is already above the Chinese average of 7.2 tons in 2011”

 “although Wuxi’s city government has set reduction targets and developed a low carbon plan, the projection results show that more ambitious efforts are needed to overcome the challenges faced and reduce the total CO2 emissions and material uses.”
Enhanced by Zemanta