Tuesday, March 31, 2015

How Will Europe Meet its 2030 Renewable Energy Goal?

Implementing the EU 2030 Climate and Energy Frame-work – a closer look at renewables and opportunities for an Energy Union (14 page pdf, Anne Held, Mario Ragwitz; Gustav Resch, Lukas Liebmann, Fabio Genoese, Intelligent Energy - Europe, ALTENER, Dec.8, 2014)

 Today we review a discussion paper that examines the changes facing the EU in achieving a 27% increase in the share of renewable energies while also reducing greenhouse gas emissions by 40 % before 2030, only 15 years away. Among the factors considered are the declining need for energy efficiencies or at least for financial renumeration as technology improves and matures, the need for states within the EU to consider implementing joint or regional plans to take advantage of and lessen negative impacts of border states. EU renew energy  

Key Quotes:

“This framework includes binding targets for (i) domestically reducing greenhouse gas emissions by 40% until 2030 compared to 1990 and for (ii) increasing the share of renewables to 27%. Finally, there is an indicative target to improve energy efficiency by at least 27% compared to “business-as-usual” projections of the future energy demand.”

“Assuming a share of 27% renewables in 2030, between 500 and 910 TWh of additional renewable energy will have to be deployed in the decade from 2020 and 2030, depending on the level of final energy demand… These are the net figures, which do not consider potentially needed replacements of older renewable energy “

 “A stronger decline of energy demand corresponding to a 30% energy efficiency target would lead to the lower boundary, while moderate energy efficiency measures (leading to energy demand savings of 21% compared to baseline) combined with no dedicated support for biofuels beyond 2020 may lead to an increase of additional net deployment of renewables in the electricity sector when compared to the decade from 2010 to 2020. When considering gross instead of net figures, the difference between this and the upcoming decade is even more striking: the additional amount of renewable electricity between 2020 and 2030 would have to remain at least on the same level as in this decade but might also have to increase by up to 46%”

“the analysis indicates a strong decline in remuneration levels for renewables over the whole assessment period as a result of expected technological progress across all key renewable technologies. This positive trend is driven by cost reductions for onshore and offshore wind as well as solar photovoltaics, which are expected to be the dominant renewable energy technologies in the power sector beyond 2020.”

“.. instead of single EU member states pledging themselves to a national target, groups consisting of several EU member states could pledge themselves to a joint or regional target. This implies to gradually move beyond strictly national energy policies towards a more co-ordinated approach as part of a broader EU vision.”

 “a common understanding on these cross-border effects enables the cooperating member states to design action plans and policies seeking to maximise beneficial cross-border effects and fairly share the burden of unfavourable ones across all affected parties.”

Thursday, March 26, 2015

How Has Germany Improved Its Air Quality?

Clean Air – Made in Germany (50 page pdf, Federal Environment Agency of Germany, Nov. 2014)

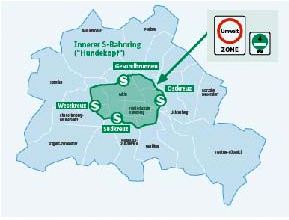
Today we review measures undertaken by the national and municipal governments of Germany over the last decade or two to reduce air pollution particularly in its cities and particularly from transportation although initiatives are also in place to deal with wood combustion and ammonia from emissions from agriculture. Specific measures include Low Emission Zones and application of road pricing, restrictions for parking and lower speed limits of 30 kph on major roads. The result is that air quality in German cities today are as high as in rural areas 20 years ago. Future challenges include reducing greenhouse gas emissions to meet EU targets and reducing NO2 and PM emissions from diesel powered vehicles.

 low emission zones berlin  

Key Quotes:

“The German government bases air pollution control on four strategies:
  • laying down environmental quality standard
  • emission reduction requirements according to the best available technology
  • product regulations
  • laying down emission ceilings”
“Air quality in German cities is as high as the air quality in rural areas 20 years ago. We reduced carbon monoxide (CO) by 90 per cent, polycyclic aromatic hydrocarbons (PAH) by 90 per cent, benzene by more than 95 per cent, nitrogen oxides by 90 per cent and particulate matter by 70 per cent.”

“these successes were achieved by technologies like flue-gas desulfurization or the use of electrostatic precipitators and catalytic converters… enforced by emission standards, which are now mainly implemented at European Union level”

“the responsibility to meet air quality levels enables local or regional authorities to set up air quality plans containing various measures to improve air quality. Well-known examples for local measures are Low Emission Zones, which exclude vehicles with low emission standards from areas within the zone…. Lorry per toll rates in Germany vary between €0.14 and € 0.29 per km depending on environmental performance.”

“The Convention on Long-range Transboundary Air Pollution is an example how states can cooperate to reduce air pollution. Commitments not to emit more than a given total amount of a pollutant are instruments which can be used within these international conventions.”

“Beside the reduction of emissions from classical sectors like traffic and industrial plants, several other fields of action have been identified. These include the reduction of particle emissions from non-road mobile machinery and domestic wood combustion as well as the reduction of ammonia emissions from agriculture”

"A municipal air quality plan comprises all emissions sources like transport, industry, power generation and households.Based on emission and exposure models of the two main pollutants PM and NO2 , air quality measures are derived…the most important component is to make car transport less attractive by means of e.g. speed limits, restrictive parking management and pricing schemes.”

“Low Emission Zone (LEZ): Reduction potentials to reduce concentration levels for LEZs highly depend on the level of access restriction. Evaluation studies of actual LEZ implemented in the years 2008–2011 result in reduction potentials of up to 10 % for NO2 , 7 % for PM10 and 10 % for PM2.5 . A high reduction potential of up to 19 % for soot (black carbon) is particularly mentioned”

“Speed limits of 30 or 40 km/h on major roads ..Reducing speed limits on major roads from 50 to 30 or 40 km/h is a measure that is especially difficult to quantify. For the additional concentration caused by road traffic, reduction potentials for road traffic of 18 % for NOX , 15 % for NO2 and 30 % for PM10 are given.”

“What are the remaining challenges and priorities for Germany?
  • climate change, in this area we still have a lot to do with regard to the further reduction of CO2 as well as of short-term climate factors like black carbon, soot, fluorocarbon or methane.
  • problems with the amount of particulate matter.
  • ·        especially in urban canyons we have problems with nitrogen dioxide (NO2 ) emitted by diesel-powered vehicles because of wrong incentives and misguiding regulations are still in place.”

Tuesday, March 24, 2015

What are the Costs and Benefits of Renewable Energy?

The Net Benefits of Low and No-Carbon Electricity Technologies (38 page pdf, Charles R. Frank, Jr., Global Economy and Development Working Paper 73, Brookings Institute, May 2014)

Today we review a research paper that examined the costs and benefits of various non-carbon energy sources, as opposed to oil and gas alternatives, under a number of carbon tax scenarios. Several factors are clear: the benefit of a stable base power or capacity as seen in either natural gas or nuclear outweigh the much lower carbon emissions from solar and wind- to the point that with a $100 per ton carbon tax, nuclear is the favoured option over wind and solar at #4 and #5. If the carbon tax is lower, solar and wind benefits are much much lower than from the other fuel sources. The case for a higher carbon tax is clear if any hope of reducing carbon emissions is to be satisfied.

 cost of renewable energy  

Key Quotes:

“It estimates the costs per megawatt per year for wind, solar, hydroelectric, nuclear, and gas combined cycle electricity plants”

“one of the main benefits of renewable energy plants is the energy cost avoided in the displacement of fossil fuel electricity production. Nuclear plants do have an energy cost. However, the energy cost of a nuclear plant is much lower than that of a fossil fuel electricity plant that it displaces.”

 “Wind, solar, and hydroelectric plants without storage are inher­ently less reliable, not because they are mechanically more prone to forced outages, but because the avail­ability of wind, sun or water is highly variable. …a wind plant with a 30 percent capacity factor can actually replace only less than a third of a coal plant with a 90 percent capac­ity factor“

“Nuclear plants have far and away the highest capacity cost. Gas combined cycle plants have far and away the lowest capacity cost” “[at $100 per ton carbon tax] A new nuclear plant becomes the most favored alter­native. Wind and solar continue to rank fourth and fifth among all the alternatives, mainly because of the very high capacity cost and the very low capacity factors.”  

Key Findings:

*reductions in carbon emissions are valued at $50 per metric ton and the price of natural gas is $16 per million Btu or less—nuclear, hydro, and natural gas combined cycle have far more net benefits than either wind or solar.
*low and no-carbon energy projects are most effective in avoiding emissions if a price for carbon is levied on fossil fuel energy suppliers. .. The price of carbon should be high enough to make production from gas-fired plants preferable to production from coal-fired plants..
*direct regulation of carbon dioxide emissions of new and existing coal-fired plants… can have some of the same effects as a carbon price in reducing coal plant emissions..a price levied on carbon dioxide emissions is likely to be a less costly way to achieve a reduction in carbon dioxide emissions.

“It is likely to be far less costly to achieve reductions in carbon dioxide emissions through an effective carbon trading system that allows the market to determine the most effective way to reduce emissions rather than through establishment of EPA standards for emissions.”

Thursday, March 19, 2015

Dynamic Road Pricing for Vancouver?

Innovative B.C. starts the road-pricing revolution (Andrew Coyne, The Regina Leader-Post Dec. 13, 2014) 

Also discussed here: The shocking truth about B.C.’s carbon tax: It works (Ross Beaty, Richard Lipsey and Stewart Elgie, the Globe and Mail, Jul. 09 2014) 

Today we review news that Vancouver area Mayors have decided to ask their voters to agree by referendum to two new “taxes” – a sales tax and a comprehensive road-pricing plan – that would be a first for any Canadian city, collect revenue from other than municipal property tax and virtually eliminate traffic congestion. One downside is that implementation would only come in 5 to 8 years - would the next elected civic administrations be up to the challenge? As jurisdictional children, the municipalities would also need to get provincial approval. There is reason to expect a positive response as B.C. is also the first province to have implemented a successful carbon tax on consumer goods 6 years ago, reaffirmed in a recent provincial election, and given citizens the lowest personal income taxes in Canada.

English: Traffic congestion along Highway 401

Key Quotes: 

“a group of Vancouver-area mayors,…will put the package to the region's voters in a referendum next spring.. Lower Mainlanders will have it within their power to bring about a revolution in public policy - three of them: 

*the first time a proposal to increase taxes was put directly to voters in Canada, via a referendum or plebiscite 

*the first municipal sales tax in Canadian history…about $125 per household annually, and earmarked for the mayors' transit plan.. a much-needed shift in the municipal tax base: away from property taxes 

*the first comprehensive system of road tolls - what the mayors call "mobility pricing" - in the world. .. all cars, all roads, all the time, adjusted dynamically in response to traffic conditions and collected electronically via on-board GPS-based transponders.. 

[and]  a Mobility Pricing Independent Commission to oversee its planning and implementation within five to eight years." 

“At a stroke, it would effectively abolish congestion, by common consensus the worst of Canada's urban blights” 

“B.C.’s tax, implemented in 2008, covers most types of fuel use and carbon emissions. It started out low ($10 per tonne of carbon dioxide), then rose gradually to the current $30 per tonne, which works out to about 7 cents per litre of gas. .. Since the tax came in, fuel use in B.C. has dropped by 16 per cent; in the rest of Canada, it’s risen by 3 per cent ” 

“B.C. now has the lowest personal income tax rate in Canada (with additional cuts benefiting low-income and rural residents) and one of the lowest corporate rates in North America”  

Tuesday, March 17, 2015

What Are the Life Cycle Pollution Impacts from Electric Cars?

Life cycle air quality impacts of conventional and alternative light-duty transportation in the United States (6 page pdf, Christopher W. Tessum, Jason D. Hill, and Julian D. Marshall, Proceedings f the Ntional Academy of the United States of America (PNAS), Dec. 15, 2014)

Also discussed here: Switching to vehicles powered by electricity from renewables could save lives (ScienceDaily, Dec. 15, 2014)

Today we review a paper that compares the amount of pollution (as PM2.5 and ozone) produced in generating power for electric powered vehicles compared with the use of conventional gasoline. Results indicate that the use of biofuels (such as ethanol from corn) increases health impacts from pollution by 80% while using renewable sources such as natural gas, wind, water or solar reduces the impact by 50% (noting that natural gas is a pollutant in terms of climate change). This study underlines the lack of benefits from biofuels in terms of pollution and health.

 eletric car power pollution  

Key Quotes:

Air pollution is the largest environmental health hazard in the U.S., in total killing more than 100,000 people per year. Air pollution increases rates of heart attack, stroke, and respiratory disease.”

 “Our assessment of the life cycle air quality impacts on human health of 10 alternatives to conventional gasoline vehicles finds that electric vehicles (EVs) powered by electricity from natural gas or wind, water, or solar power are best for improving air quality, whereas vehicles powered by corn ethanol and EVs powered by coal are the worst.”

“powering vehicles with corn ethanol or with coal-based or “grid average” electricity increases monetized environmental health impacts by 80% or more relative to using conventional gasoline. Conversely, EVs powered by low-emitting electricity from natural gas, wind, water, or solar power reduce environmental health impacts by 50% or more”

“Their analysis included not only the pollution from vehicles, but also emissions generated during production of the fuels or electricity that power them. With ethanol, for example, air pollution is released from tractors on farms, from soils after fertilizers are applied, and to supply the energy for fermenting and distilling corn into ethanol.”

"Our work highlights the importance of looking at the full life cycle of energy production and use, not just at what comes out of tailpipes,"

Thursday, March 12, 2015

Is it Time for Carbon Taxes at the State/Provincial/City Sub-national Level?

Economic and Emissions Impacts of a Clean Air Tax or Fee in Oregon (SB306) (169 page pdf, Legislative Revenue Office, State of Oregon, Dec. 2014)

Also discussed here: Time to talk carbon tax: Conversation kicks off with Medford rally, report from PSU (Wendy Culverwell, Portland Business Journal, Dec. 5, 2014)

And here: Carbon Tax and Shift: How to make it work for Oregon’s Economy. (36 page pdf, Liu, Jenny H. and Renfro, Jeff, Northwest Economic Research Center Report, Mar. 1, 2013)

And here: Lima Call for Climate Action Puts World on Track to Paris 2015 (Press Release, United Nations Framework Convention on Climate Change, Dec. 14, 2014)

And here: NAZCA- The Non-state Actor Zone for Climate Action (Cooperative And Individual Actions On Climate Change In Partnership With Countries , United Nations Framework Convention on Climate Change, Dec. 2014)

On the eve of the UN’s last Conference of the Parties (COP20) in Lima which aimed to lay out a path to achieve the major reductions in carbon emissions needed by 2050, we review the plans and analyses of a state in the northwest USA. Oregon is considering a levy that would reduce its emissions to 1990 levels by 2030 at $100/ton tax. Detailed economic impacts include the gain in revenue of over $2B at a carbon tax of only $60/ton. Potential negative impacts such as reduced tourism income or a loss of competitiveness with neighboring states were found to be small or insignificant. This is precisely the kind of effort needed by sub-national entities to be able to make long and short term commitments which would reduce the severity of climate change impacts

. oregon carbon tax  
Key Quotes:

 A new 2015 agreement on climate change, that will harness action by all nations, took a further important step forward in Lima following two weeks of negotiations by over 190 countries. Nations concluded by elaborating the elements of the new agreement, scheduled to be agreed in Paris in late 2015, while also agreeing the ground rules on how all countries can submit contributions to the new agreement during the first quarter of next year.”

“Although a number of northern European countries such as Norway, Ireland …and Sweden have instituted carbon taxes, the BC carbon tax is unique as the first carbon tax to be implemented across all economic sectors in North America”

 “The consumption of refined petroleum products between 2008-2011 decreased by 15.1% in BC and increased by 1.3% in the rest of Canada, and the consumption of motor gasoline in the same period decreased by 4.0% in BC and increased by 3.3% in the rest of Canada.”

“In 2010, Ireland began to levy a carbon tax on fossil fuels, including kerosene, diesel fuel, liquid petroleum, fuel oil, and natural gas, and the tax was expanded to include solid fuels such as peat and coal in 2012….The tax is estimated to generate €500 million in revenue in 2013, and can potentially offset approximately 3.5% of the Irish income tax”

“The Oregon Legislature allocated $200,000 to the study, which was designed to look at how a carbon tax will affect the state and business”

 “A separate 2013 report from the Northwest Economic Research Center calculates that levying a $60 tax for every ton emitted would raise more than $2.1 billion for state coffers. It notes that it would take a tax of $100 per ton to reduce Oregon emissions to 1990 levels by 2030.”

 “putting a price on carbon in Oregon can result in reductions in harmful emissions and have positive impacts on the economy.. Carbon emissions impose negative externalities on society, such as damage to property and critical infrastructure, increased health costs, losses of natural resources including drinking water supplies and other potential effects of climate change, leading to serious global market failures. Thus, the social costs of climate change need to be incorporated into the decision-making processes of energy suppliers, consumers and policy makers to reduce potential economic inefficiencies and major economic losses”

“A carbon tax is efficient when its rate is set at a level that is equivalent to the full marginal social cost of carbon (SCC), and it is also effective when it achieves its intended policy objectives. “

“As a general rule of thumb, a carbon price of $1 per mTCO2 corresponds to a $0.01 increase in the price of a gallon of gas. For natural gas, we expect a carbon price of $10 per mTCO2 to lead to a 3% increase in price and a carbon price of $100 per mTCO2 to increase prices by 31%.”

Tuesday, March 10, 2015

Modelling Emissions from Stop-and-Start Traffic Congestion

A congestion sensitive approach to modelling road networks for air quality management (Abstract, James O'Brien; Anil Namdeo; Margaret Bell; Paul Goodman, Int. J. of Environment and Pollution, Dec. 2014)

Also discussed here: Stop-start driving in city centres creates higher pollution levels (Phys Org, Dec. 12, 2014)

And here: New regional traffic model to combat urban road congestion (Phys Org, Jan. 9, 2014)

And here: Verkeersvoorspellingen met modellen: een voorspelling over modellen (in Dutch language) (3 page pdf, Victor L. Knoop and Serge P. Hoogendoorn, Nationaal verkeerskundecongres, 6 Nov. 2013)

 Today we review research into improved modelling of emissions from congested traffic which takes into account instantaneous starts and stops instead of assuming a constant speed of vehicles. The results indicate that previous mobile transportation pollution models may underestimate emissions by as much as 60%.and this has large potential consequences for environmental impact assessments of large transportation projects, as well as for regulating or reducing emissions from currently congested cities.

 traffic model

 Key Quotes:

 “Traditional methods of modelling traffic pollution could be under-estimating emissions by as much as 60%”

“Previously, traffic emissions models have only looked at the average speed of traffic as a whole and assumed traffic was travelling at the same speed at the same time, ignoring the stop-start related vehicle emissions often associated with congestion.”

“The new technique, called PITHEM (Platform for Integrated Traffic, Health and Environmental Modelling), looks at congestion emissions based on individual vehicle type, its speed and acceleration and, crucially, takes into account meteorology and local terrain”

“Findings from microscale modelling have revealed that the use of an IEM [instantaneous emissions model ]to calculate emissions as an input for air quality dispersion modelling significantly improved the performance of the dispersion modelling when measured against monitored data. Findings from microscale modelling have revealed that the use of an IEM to calculate emissions as an input for air quality dispersion modelling significantly improved the performance of the dispersion modelling when measured against monitored data.”

"Whereas previous models looked at 'steady state' traffic conditions, in reality, during peak hours congestion vehicles often decelerate and accelerate and move at different speeds, especially when the road goes up or down hills.”

 "By gaining a better understanding of how road networks are influencing emissions, councils can make more effective decisions about how to deal with congestion in our city centres and help reduce the 50,000 premature deaths in the UK each year that are associated with traffic emissions."

 “The model currently only works with cars, but Knoop and his colleagues hope to be able to integrate pedestrians and cyclists into it in the future. He is also hoping to expand the tool in order to calculate emissions.”