Friday, July 29, 2011

Can Simulation Modelling Steer Us toward Sustainability?

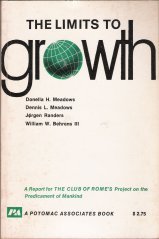
Cover of "The Limits to growth: A report ...Cover via AmazonVirtual Sustainability (16 page pdf, Sims Bainbridge, W. Sustainability 2010, 2, 3195-3210, Sep. 30,2010)

Also discussed here: System Dynamics

And here: Limits to Growth

Models simulating the ways that people interact with the natural world and themselves have long been used to create scenarios that allow environmental and economic policies to be tested. The World 2 model was developed Jay W. Forrester in 1970 using system dynamics techniques to examine global energy and consumption trends, and led to the “Limits to Growth” book from the Club of Rome. The article reviewed today takes that concept further by examining social interactions in an online multi-player environment to test such propositions as telecommuting.


Key Quotes:

“online role-playing games may serve as tools for advancing sustainability goals:
  • by moving conspicuous consumption ..into virtual environments.. reduce the need for physical resources
  • prepare individuals to be teleworkers, .. to replace much transportation technology, notably in commuting.
  • virtual worlds and online games build international cooperation
  • potential social benefits of this new technology may urge us to reconsider a number of traditional societal institutions”
“a survey of 78 US government agencies found that less than nine percent of workers whose jobs made them eligible for telework were in fact doing it even on a limited part-time basis.. Virtual worlds allow users to become familiar with a range of tele-activites, as well as gaining facility in using the technology”

“One does not need to be a congenital pessimist to doubt that minor changes can save our dying civilization. With that in mind, gamelike virtual worlds may be useful experimental laboratories for possible radical transformations of real society in the future. They may even serve as effective training grounds for the citizens of the future, and offer a bridge to that future over which many people may begin to cross, even today”
Enhanced by Zemanta

Thursday, July 28, 2011

Comparing the Health Risks of Smoking and Air Pollution

This is an x-ray image of a chest. Both sides ...Image via WikipediaLung Cancer and Cardiovascular Disease Mortality Associated with Ambient Air Pollution and Cigarette Smoke: Shape of the Exposure-Response Relationships (31 page pdf, Pope CA III, Burnett RT, Turner MC, Cohen AJ, Krewski D, Jerrett M, et al, Environ Health Perspect, Jul. 19, 2011)

Today’s review article looks at how the health response of exposure to tobacco smoke and particulate matter compare in terms of the intensity and duration. The main finding is that projections or extrapolations of fatality risk from exposure to low levels can be underestimated while risks from higher levels may be overestimated, thus pointing to the need to monitor and develop public health policies for relatively low levels of ambient air pollution.


Key Quotes:

“Lung cancer and cardiovascular disease mortality risks increase with smoking, second hand smoke (SHS) and exposure to fine particulate matter (PM2.5) from ambient air pollution”

“For cardiovascular disease (and related cause-of-death groupings) the fitted function {RR=1 + 0.2685(dose)0.2730} indicates an exposure-response relationship that is substantially non-linear—that is much steeper at the very low levels of exposure compared with higher levels of exposure"

“For lung cancer mortality, the relative risks steadily increase to nearly 40 at the highest increment of cigarette smoking (>42 cigarettes/day), whereas for cardiovascular disease mortality, the relative risks level off at approximately 2.0-2.5”

“For lung cancer mortality, excess risks rise nearly linearly throughout the full range of exposure from SHS, air pollution, and active smoking, reaching maximum relative risks over 40 for heavy smokers”

“smoking duration appeared to have a much larger impact on lung cancer mortality than cardiovascular disease mortality”

“Carcinogens found in tobacco smoke and in combustion-source air pollution are the likely agents responsible for the excess lung cancer risk. Fine particles transport many of the toxic and carcinogenic substances in smoke, and may contribute to pulmonary and systemic inflammation”

“the steep exposure-response for cardiovascular disease mortality at low levels of exposure and the leveling off at high exposures is a saturation phenomenon whereby relatively low levels of exposure are capable of activating relevant biological pathways”

“For cardiovascular disease, inappropriate extrapolations of linear exposure-response functions may result in substantial over estimates in areas with very high exposures and, in some cases, potential underestimates in areas with relatively low exposures”
Enhanced by Zemanta

Wednesday, July 27, 2011

Ambient Air Pollution in Canada and Environmental Pricing

Background Report: Managing Industrial Air Emissions in Canada (22 page pdf, Prepared for Sustainable Prosperity by Nashina Shariff, June 2011)

The article under review today is a rare (public) look at the state of how the management of air pollution is carried out in Canada. The study concludes that the historic top-down, national/ provincial command and control policies could be replaced with the more effective pricing of emissions where a price is put on exceeding defined thresholds.

TAXATION LEVELS WITH DIFFERENT AIR QUALITY ISSUES

       PRICE


                                                                                                                         EMISSIONS

Key Quotes:

“[quoting the CMA] in 2008, as many as 21,000 Canadians would die prematurely from the effects of air pollution. That year, there would be over 9,000 hospital visits, 30,000 emergency department visits and 620,000 doctor's office visits due to air pollution. The economic costs of air pollution would top $8 billion in 2008, rising to over $250 billion by 2031”

“The Canadian Medical Association estimates that by 2031 almost 90,000 people will have died from the acute effects of air pollution, the number of deaths due to long-term exposure to air pollution will be 710,000”

“there is a growing interest in applying economic instruments, such as emissions trading and emissions charges2 , to incent improved environmental performance and achieve air quality objectives”

“PM and ozone levels in many cities are consistently above the Canada-Wide Standard (CWS). In the period from 2003 - 2005, at least 30 per cent of Canadians lived in communities with PM2.5 levels above the CWS, for ozone, this figure is 40 per cent”

“Three key examples of federally set ambient air quality standards are the National Ambient Air Quality Objectives, the Canada Wide Standards for PM and Ozone and the recently introduced Comprehensive Air Management System”

“Since the mid-1990’s, there has been an ongoing trend away from coercive policy tools in favour of incentive-based tools (most commonly referred to as economic instruments) such as emission charges, emissions trading schemes, subsidies and voluntary initiatives to spur desirable environmental action”

“Emissions pricing systems, such as cap-and-trade systems or emissions charges, potentially offer a more economically efficient mechanism for achieving emissions reduction levels.”
Enhanced by Zemanta

Tuesday, July 26, 2011

Roadside Emission Impacts on Health in New Zealand

Air-pollutionImage via WikipediaNIWA launches biggest-ever scientific air quality campaign (Our Science, National Institute of Water & Atmospheric Research(NIWA), Sep. 2, 2010)

Also discussed here: Scientists are investigating traffic-related air pollution (Scoop, Jul. 15, 2011)

The focus of today’s review is a research study launched in 2010 to assess the contributions of roadside emissions from vehicles and from wood smoke to health risk. Particular attention is paid to the health risks for children in schools from both indoor and outdoor air pollutio

Video describing project

Key Quotes:

“NIWA is looking at the long-term effects of motorways and wood smoke on air quality. Scientists are assessing the impacts of Auckland’s southern motorway on air quality in a surrounding neighbourhood”

“One of the aims of this work is to find out how we might reduce the number of people exposed to health-endangering concentrations of air pollution close to motorways”

“In New Zealand, there is a risk that National Environmental Standards for air quality (and World Health Organisation WHO guidelines) might be breached alongside major roads”

“Cars and trucks are the most significant source of ultra-fine particles, and air pollution, in many cities. New findings suggest that ultra-fine particles (the tiny flecks of soot and fumes that come from traffic and wood smoke) are more toxic than larger particles”
Enhanced by Zemanta

Monday, July 25, 2011

Why More and Safer Bike Paths Make Sense

The Bicycle Dividend (Nancy Folbre, Economix, New York Times, Jul. 4, 2011)

Also discussed here: The Bicycle Dividend (StreetsBlog, Jul. 15 ,2011)

We return to a focus today to the benefits of cycling, on the one hand, compared to the high costs to society of driving cars.


Key Quotes

“More Americans are biking or walking to work these days, in part because public-sector investment is improving the infrastructure they need to get there safely”

Portland, Ore., tops the list, with 5.8 percent of workers riding to their jobs on a regular basis. Snowy Minneapolis comes in second, at 3.9 percent, and Seattle third, at 3 percent…New York City was still below 1 percent…bike share of local trips ranges from 1 percent in the United States to 18 percent in Denmark to 27 percent in the Netherlands”

“Cars enjoy huge direct subsidies in the form of road construction and public parking spaces.. Yet cars impose major social costs: their use contributes to global warming, traffic congestion, accident fatalities and sedentary lifestyles”

“about 40 percent of all automobile trips in metropolitan areas are less than two miles – a distance easily biked”

“As bike paths on roads attract larger numbers of cyclists, the chance of car-related accidents declines, promoting further use. Safety appears to be a major factor for women in particular”
“Construction of bike paths offers more job creation per infrastructure dollar than investment in roads.”
Enhanced by Zemanta

Friday, July 22, 2011

How Does Particulate Matter Affect the Brain

Air pollution impairs cognition, provokes depressive-like behaviors and alters hippocampal cytokine expression and morphology (L K Fonken, X Xu, Z M Weil, G Chen, Q Sun, S Rajagopalan and R J Nelson, Molecular Psychiatry , Jul. 5, 2011)

Also discussed here:Air Pollution Linked to Learning and Memory Problems, Depression (Science Daily, Jul. 6, 2011)

The journal article reviewed today looks at the health impacts of air pollution, not on heart and lungs, but on the brain, specifically dendrites. The authors found that prolonged exposure has negative effects which can lead to a number of health problems.


Key Quotes:

” The central nervous system may be adversely affected by activation of reactive oxygen species and pro-inflammatory pathways that accompany particulate matter pollution”

“The researchers looked specifically at branches that grow off of nerve cells (or neurons) called dendrites. The dendrites have small projections growing off them called spines, which transmit signals from one neuron to another. Mice exposed to polluted air had fewer spines in parts of the hippocampus, shorter dendrites and overall reduced cell complexity.”

"The results suggest prolonged exposure to polluted air can have visible, negative effects on the brain, which can lead to a variety of health problems,"

"This could have important and troubling implications for people who live and work in polluted urban areas around the world."
Enhanced by Zemanta

Thursday, July 21, 2011

Air Pollution at Airports

Tarom Boeing 737-300 (YR-BGC) and United Airli...Gate Wait for Better Air (1 page pdf, Environmental Health Perspectives, Forum, Jul. 1, 2011)

Also discussed here: Demonstration Of Reduced Airport Congestion Through Pushback Rate Control (20 page pdf, I. Simaiakis, H. Khadilkar, H. Balakrishnan,T. G. Reynolds and R. J. Hansman, B. Reilly, S. Urlass, Report No. ICAT-2011-2, MIT International Center for Air Transportation (ICAT), January 2011)

Today’s review article looks at ways to reduce emissions at airports by reducing taxiing times for aircraft preparing to take-off. Statistics indicate that an aircraft may spend as much as 30% of its time between push-off at the gate and landing at the next airport taxiing on runways - and this contributes to the pollution levels found in and and around airports which, more and more, are embedded in the suburban areas of many cities.


Key Quotes:

“in Europe .. estimated that aircraft spend 10-30% of their flight time taxiing, and that a short/medium range A320 expends as much as 5-10% of its fuel on the ground”

“Domestic flights in the United States emit about 6 million metric tones of CO2, 45,000 tonnes of CO, 8,000 tonnes of NOx, and 4,000 tonnes of HC taxiing out for takeoff; almost half of these emissions are at the 20 most congested airports in the country”

“The average taxi-out time at Logan is about 20 minutes. Holding 247 flights at the gate for an average of 4.3 extra minutes reduced taxiing time by an average of 20%, and fuel consumption dropped by 16–20 gallons per plane”

“Hazardous air pollutants measured at or near airports include nitrogen dioxide, polycyclic aromatic hydrocarbons, fine particles, carbonyls, and volatile organic compounds.3,4,5 These pollutants have been generally linked to cancer,6 heart attack,7 and type 1 diabetes”
Enhanced by Zemanta

Wednesday, July 20, 2011

Urban Traffic and Social Space

The psychology of urban mobility (Carlos Felipe Pardo, Cities for Mobility World Congress, Stuttgart, Jul. 3-5,2011)

Also discussed here: Toward a new paradigm for transport in cities: Let’s see what Carlos Pardo has to say (Eric Britton, World Streets, Jul. 12, 2011)

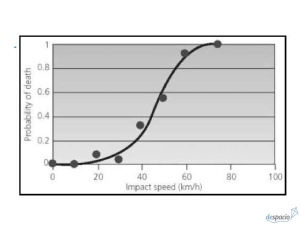
The highly graphical presentation by Carlos Pardo on social space and urban mobility is the focus of today’s review. It highlights some of the most important aspects of how traffic impacts communities. Examples shown below are the increased risk of death as speed limits increase from 20 kph (under 10%) to 60 kph (almost 100%), Appleyard’s graphic showing how interpersonal socializing along streets declines rapidly as the flow and speed of traffic increases and the range of travel modes (walking, cycling, transit and private car).


Key Quotes:

Light traffic: Leads to a daily life situation where you know and have contact with lots of people in your neighborhood”

Heavy traffic: and not only do you no longer cross the street for a visit, but you rarely even go to visit someone living on your own side of the street”

“how we perceive space:
  • With people/faces/interactions
  • Shorter distances/travel times
  • Eyes on the street
  • Diverse land use”
Enhanced by Zemanta

Tuesday, July 19, 2011

Why Are Some Cities Safer for Cycling?

Evidence on Why Bike-Friendly Cities Are Safer for All Road Users (12 page pdf, Wesley E. Marshall, Norman W. Garrick, Environmental Practice, March 2011)

Also discussed here: Beyond Safety in Numbers: Why Bike Friendly Cities are Safer (Norman W. Garrick, Wesley E. Marshall, Planetizen, Jun. 27, 2011)

And here: Segregated Bike Lane Pilot Project (City of Ottawa)

Today’s review article – safety for cyclists- is quite timely for this blogger who lives in the first city in Canada’s largest province to get segregated bike lanes (opened July 10), prompted mainly out of a concern for cyclists’ safety when they have to travel in close proximity to vehicles. The article assesses factors from 24 cities in California, U.S. that seem to be linked to low accident and low fatality rates- ranging from safety in numbers (of cyclists) to street density to street design. The safest city (Davis) had a fatal crash rate which was 1/7th of the average for the country. Making a city safe for cyclists will also encourage more motorists to leave their polluting machines at home, of course, so that the safety aspect also affects the broader health interests of the public at large.


Key Quotes:

“With a fatal crash rate in Davis of less than 2.1 per 100,000 residents over that time, far fewer people are killed on their roads than in the United States as a whole, which averaged 14.8 fatalities per 100,000 residents over that same time frame.. compare extremely favorably with the countries reporting the lowest crash rates in the world, such as the Netherlands at 4.9 per 100,000 residents ..which happens to boast a bicycling mode share near 27%”

“cities with higher transit use also tend to have lower overall fatality rates”

“[Copenhagen] between 1990 and 2000, a 40% increase in bicycle-kilometers traveled corresponded to a 50% decrease in seriously injured bicyclists”

“when the number of bicyclists increases to the point where drivers begin to expect frequent conflicts with bicyclists, driver expectations and behavior could change for the better”

“For all road users, the chance that a crash would result in a fatality tended to be lower for the cities with lower-density street networks. This same trend was found for vehicle crashes, pedestrian crashes, and bicycle crashes.”

“street networks in these safer cities with high bicycling had a much higher degree of street connectivity as compared to the safe cities with low bicycling”

“safety for all road users may result from reaching a threshold of bicyclist volumes that compels cars to drive more slowly”

“high intersection density appears to be related to much lower crash severities”
Enhanced by Zemanta

Monday, July 18, 2011

How Can Transportation Technology and Practices Reduce Greenhouse Gas Emissions?

Technologies for Climate Change Mitigation: Transport Sector (250 page pdf, United Nations Environment Programme Risø Centre on Energy, Climate and Sustainable Development, March 2011)

Also discussed here: New Report: Transportation, Technology and Climate Change (The City Fix, Jul. 7, 2011)

The focus today is on a comprehensive guide to reducing greenhouse gas emissions in transportation- either through improved technologies or in reducing travel with carbon consuming vehicles by such options as transit-oriented development, road pricing or by using electric powered vehicles and many other possibilities. Comparisons are made between the developed and underdeveloped worlds and between urban areas in each.


Key Quotes:

“In 2006, transport contributed 23 percent of global CO2 emissions, and substantial increases are projected, particularly in developing countries”

“The developed world, for example, needs to overcome its car dependence, its low urban densities and highly segregated land use patterns…The developing world.. have denser,more mixed-use urban areas, less car dependence, and greater use of public transport..However, it often faces significant problems of traffic congestion, air pollution and inadequate provision and quality of transport infrastructure and services”

Some approaches:
  • Increasing use of low carbon modes– walking, cycling and mass transit (trains, buses and light-rail).
  • Reducing overall travel-high-density, mixed-use developments built around rail nodes, changes to urban areas so that they are denser, increased mass transit, walking and cycling
  • Making current modes more low carbon: -cars, trucks, motorbikes, motor scooters and three-wheeler
taxis
  • Moving goods:- rail and water-based freight, to multimodal freight trips
  • Lower carbon air and water transport
“As with cars, buses in US and Canadian cities are the most energy consumptive (between 24 and 29 MJ/km, compared to an average of 16 MJ/km in all other regions”

“Urban rail modes, taken together across regions, are on average 4.6 times less energy consuming than the average car (0.54 compared to 2.45 MJ/passenger km)”

US cities dominate in their oil consumption and car use with a significant difference between Atlanta with 103 GJ/person, Houston with 75 GJ/person and New York with 44GJ/person…Australian, Canadian and New Zealand cities follow this with 30 to 40 GJ/person.”
Enhanced by Zemanta

Friday, July 15, 2011

When does driving slowly become congestion?


Through his World Streets blog, Eric Britton provided the focus for today’s review which is about the need for vehicles to slow down and the added risks to life and limb from speeding which is accentuated with the You-Tube video above. A useful collection of links to earlier posts on Word Streets is given HERE

SLOWTH: Or why it is so very important (and so very easy) to slow down traffic in cities
(World Streets, Jul. 8, 2011)

Key Quotes:

“Slowth is a new mobility transport planning concept, usually deployed in congested urban environments, where transport is calibrated for lower top speeds, but the result is shorter overall travel times across the entire system” (Wiki)

Thursday, July 14, 2011

Greenest Cities in the U.S. and Canada

US and Canada Green City Index - Assessing the environmental performance of 27 major US and Canadian cities (71 page pdf, conducted by the Economist Intelligence Unit, sponsored by Siemens, July 2011)

Today’s review article comes from the Economist which assessed over two dozen cities in the US and Canada in terms of performance under 9 factors which are seen in the graphics below for two of the Canadian cities, Calgary and Ottawa which both ranked in the middle of the pack (both cities scored high in water use efficiency and lower in air quality, particularly in CO2 emissions). San Francisco, New York City and Vancouver were leaders in the group.


Key Quotes:

“US and Canadian cities excel in several areas. Water infrastructure, recycling levels and environmental governance mechanisms are comparable to the best cities the Green City Indexes have evaluated around the world”
  • “[CO2] The difference between US and Canadian cities is large, with the former emitting 16 metric tons per person and the latter only about half that much, at 8.1 metric tons”
  • “[Energy] Most cities have only partial or even no policies to promote the use of green energy in homes or businesses through subsides or tax breaks”
  • “[LandUse] All but one city has at least some policy to sustain and improve the quantity and quality of green space, and two thirds have active tree planting programs”
  • “[Building] On average, the Index cities have 6.4 LEED-certified buildings per 100,000 inhabitants”
  • “[Transport] US and Canada Index cities on average have only 1.7 miles of public transport network for every square mile of area, which is about half the 3.1 miles of European cities of the same wealth.. :in Canada, the average figure is 6.2 miles of public transport network per square mile, compared with just 0.7 miles per square mile in the US.. Fewer people on average commute by car to work in the Canadian Index cities, at 74%, compared with those in the US, at 90%.”
  • “[Water] Residents of Index cities use an average of 155 gallons of water per person per day.. The overall average is about twice as high as in other parts of the world…the average leakage rate is just 13%, which beats even the wealthy cities of Europe, at 16%.”
  • “[Waste] . On average 26% of waste is recycled in all cities in the Index, compared with 28% in the wealthier European cities”
  • “[Air] Air quality targets, on the other hand, are slightly less widespread: only 12 out of 27 cities score full marks for this indicator”
  • “[Environmental Governance] In their efforts to manage environmental governance, US and Canada Index cities are comparable to those of the high-income European cities.. 11 had done a comprehensive baseline review and 14 had set targets in every area”
Enhanced by Zemanta

Wednesday, July 13, 2011

How does driving contribute to climate change?

The Role of Driving in Reducing GHG Emissions and Oil Consumption (45 page pdf, EMBARQ and the World Resources Institute, Jul. 6, 2011)

The focus of today’s review is a report on how reductions in vehicle miles travelled (VMT), much more efficient automobile technology (double the mileage per gallon) and actions to reduce driving by walking and cycling and traffic demand measures, such as road pricing, could reduce CO2 emissions from driving by as much as 80% over the next 40 years.


Key Quotes:

“Transportation represented 71 percent of oil consumption and 31 percent of carbon dioxide (CO2) emissions in the United States in 2008”

“the United States must achieve significant improvements in vehicle technology and reduce vehicle miles traveled (VMT) per capita (compared to business as usual projections for 2050, which anticipate a 40 percent increase in VMT per capita over 2010 levels) to meet these targets”

Recommendations:

Department of Transportation:
  1. “Encourage states and regions to boost usage of existing funding flexibility ..to reduce VMT, GHG emissions, and oil use;
  2. Provide technical support for standardized evaluation of programs and projects; and
  3. Simplify public access to DOT’s project spending databases.."
Congress:
  1. Establish national goals for transportation .. and track progress toward these goals…
  2. Increase direct funding for programs and strategies that reduce GHG emissions, VMT, and oil consumption..”
“for a typical one-school program, an increase in 100 students walking or biking to school reduced 32,976 pounds of CO2 emissions and saved 1,674 gallons of gasoline per year”

“variable tolling in 2001 resulted in 7.4 percent of auto users modifying their trips, including 20 percent of the “modifying” group shifting to transit”

“transportation emissions are laid out in CLEAN-TEA:
  1. Efforts to increase public transportation ridership;
  2. Efforts to increase walking, biking, and other nonmotorized transportation;
  3. Implementation of zoning and other land use regulations..
  4. Travel demand management programs (including carpool, vanpool, or car-share projects); transportation pricing measures; parking policies; and programs to promote telecommuting, flexible work schedules, and satellite work centers;
  5. Highway and transit operational improvements..
  6. Intercity passenger rail improvements;
  7. High-speed rail improvements;
  8. Intercity bus improvements;
  9. Freight rail improvements;
  10. Use of materials or equipment associated with ..transportation projects that reduce oil consumption and greenhouse gas emissions; and
  11. Public facilities for supplying electricity to electric or plug-in hybrid-electric vehicles
Enhanced by Zemanta

Tuesday, July 12, 2011

The Impacts of “Free” Parking

Free Parking or Free Markets (13 page pdf, Donald Shoup, Access Vol. 38, University of California, Spring 2011)

Today’s review article looks at the benefits of having parking rates vary by demand, with some very interesting statistics from New York City on the amount of wasted driving while searching for empty spaces that are not likely to exist because of static pricing. Also discussed are the downsides of mandatory off-street minimum parking requirements.


Key Quotes:

“28 percent of the drivers on a street in Manhattan and 45 percent on a street in Brooklyn were cruising for curb parking..the average time it took to find a curb space in a 15 block area of the Upper West Side of Manhattan was 3.1 minutes and the average cruising distance was 0.37 miles”

“performance pricing[benefits]:

*curb parking will perform more efficiently. If all but one or two curb spaces are occupied on every block, parking will be well used but also readily available.

*cruising for curb parking will not congest traffic, waste fuel, pollute the air, and waste drivers' time. *the local economy will perform more efficiently. In business districts, drivers will park, buy something, and leave promptly, allowing other customers to use the spaces”

“If the meters are priced right, cars will fill most of the curb spaces, leaving only one or two vacant spaces on each block. If most curb spaces are filled, parking meters can't be chasing all the customers away”

“Parking requirements hide the cost of parking, but they cannot make it go away, and free parking often means fully subsidized parking”
Enhanced by Zemanta

Monday, July 11, 2011

The Politics of Congestion Pricing

Political and Public Acceptability of Congestion Pricing: Ideology and Self-Interest in Sweden (7 page pdf, Björn Hårsman and John M. Quigley, Access Vol. 38, University of California, Spring 2011)

Stockholm is famous in road pricing circles for having the world’s first congestion charging system approved through a plebiscite. Why this is so is the focus of today’s review article which examines the link to political party preference and the value of the charge as a function of where the location and trip length of the voting public. The results seem to indicate that the larger the congestion zone and the number of people who could benefit, the more likely is its acceptance.


Key Quotes:

“voters who resided inside the cordon were more likely to favor the toll system. Not only did these residents, on average, face lower costs (that is, no toll charges) if they commuted to the central core, but their homes and neighborhoods also benefited from the reduced traffic within the cordon”

“better educated voters and working-age voters tended to favor the tolls, while male workers and immigrants tended to oppose them”

“Voters in traffic zones where the average time savings were higher were more likely to support the congestion charge In contrast, voters in zones where the average cost of a trip rose the most were less likely to support congestion charging. And voters who lived in zones within the tolling area were more likely to favor the congestion tolls.”

“the transit share of a zone’s commuters appears to explain none of the variation in voting outcomes”

“a 10 percent decrease in commute time could increase the propensity to favor the tolling system by an average of 2 percentage points. A 10 percent increase in the incremental costs of commuting, by contrast, is associated with a decline of 4 percent in the approval rate of congestion tolls.. one hour of travel time saving is valued at between 53 and 69 SEK
Enhanced by Zemanta

Friday, July 8, 2011

Spillover Parking and Minimum Municipal Offstreet Parking Requirements

Who's afraid of the spillover bogey?

(Reinventing Parking, Jul.4, 2011)

Today’s focus is on the perceived problem of spillover parking which could be treated as an opportunity rather than a curse - if parking rates were raised like traffic, according to demand.


Key Quotes:

“Spillover parking is nuisance parking that takes place outside a motorist's actual destination. And fear of Spillover Parking is central to all conventional parking policy”

“local governments all over the world enact costly regulations (minimum parking requirements) to make sure all premises have enough parking”

“the neighbours of a development with a full parking lot are not helpless victims. We CAN prevent parking that we don't want. Or we could welcome it and price it (and maybe even profit from it).”

“Parking outside some of your destinations is the whole idea of a park-once district where motorists walk to various destinations after parking anywhere in the area”
Enhanced by Zemanta

Thursday, July 7, 2011

Re-Urbanization and the Decline of Car Use

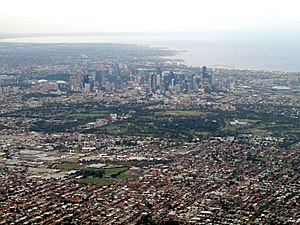
Aerial view of central Melbourne. (February 20...Image via WikipediaGoing down? Newman and Kenworthy on Peak Car Use (World Streets: The New Mobility Agenda, Jun. 23, 2011)

And here: Peak car use: urban planning needs to change say Newman and Kenworthy (The FifthEstate, May 26, 2011)

Today, the focus is on the declining use of cars in cities as a result of several factors which started before the recent large increase in fuel prices. This lowering of reliance on cars is having major impacts on the rebirth of the inner city, the end of sprawl and, generally, a higher quality of life and cleaner air for those who live in the urban core.

Key Quotes:

“Getting control of car use overall, and more particularly in and around cities, is a critical building block of the strategy needed to ensure sustainability and social justice”

“The first signs of declining car use in cities are being observed…six interdependent factors are examined that could help to explain this unexpected phenomenon:

Hitting the Marchetti Wall:

- all cities have a similar average travel time budget of around one hour; a Walking City can expand to 5-8km wide before it becomes dysfunctional; a Transit City based on an average speed of 30 km/h for trains can extend to 30 km; Automobile City based on an average speed of 50 km/h in cars can reach out to 50 km wide

The Growth of Public Transport

-in ten major US cities from 1995 to 2005 transit boardings grew 12% from 60 to 67 per capita, five Canadian cities grew 8% from 140 to 151, four Australian capital cities rose 6% from 90 to 96 boardings per capita, while four major European cities grew from 380 to 447 boardings per capita or 18%

The Reversal of Urban Sprawl

-the return of small supermarkets to the central business districts of cities as residential populations increase and demand local shopping opportunities within an easy walk. Overall, this reversal of urban sprawl will undermine the growth in car use

The Aging of Cities

-People who are older tend to drive less

The Growth of a Culture of Urbanism

-older people move back into cities from the suburbs – the so-called ‘empty nester’ syndrome

The Rise in Fuel Prices”

-The vulnerability of outer suburbs to increasing fuel prices was noted in the first fuel crisis in 1973-4 and in all subsequent fuel crisis periods when fuel price volatility was clearly reflected in real estate values"
Enhanced by Zemanta

Wednesday, July 6, 2011

Sustainable Urban Transportation Principles

Created in Photoshop, based on "Sustainab...Image via WikipediaCars and cities: Time for a paradigm change (World Streets, Apr. 20, 2009)

Today’s focus is a 2009 post from Australian Jeff Noteworthy who points out 10 characteristics of a modern city undergoing a paradigm shift toward sustainability, removing the bias toward unsustainable support of roads built and used solely for vehicles.

Key Quotes:

(1) The city has a compact, mixed-use urban ...

(2) The natural environment permeates the city’s spaces and embraces the city..

(3) Freeway and road infrastructure are de-emphasised in favour of transit, walking and cycling infrastructure

(4) extensive use of environmental technologies for water, energy and waste management..

(5) The central city and sub-centres within the city are human centres that emphasise non-auto access..

(6) The city has a high quality public realm throughout that expresses a public culture, community, equity and good governance..

(7) The physical structure and urban design of the city..are highly legible, permeable, robust, varied, rich, visually appropriate and personalised for human needs

(8) The economic performance of the city and employment creation are maximised through innovation, creativity and the uniqueness of the local environment, culture and history..

(9) Planning for the future of the city is a visionary ‘debate and decide’ process, not a ‘predict and provide’, computer-driven process ..

(10) All decision-making is sustainability-based integrating social, economic, environmental and cultural considerations, as well as compact, transit-oriented urban form principles.."
Enhanced by Zemanta

Tuesday, July 5, 2011

Why Pedestrians are a Priority in Europe - and not so much in North America

Europe Stifles Drivers in Favor of Alternatives(Elisabeth Rosenthal, New York Times, Jun. 27, 2011)

Also discussed here: Europe Stifles Drivers in Favor of Alternatives(Herald-Tribune, Jun. 27, 2011)

The focus of today’s review is a discussion about changes taking place in many European cities that put the convenience of pedestrians higher than that of drivers. The result is that much fewer households see a need for - or even own - a private vehicle, relying on walking, cycling and public transit for their mobility needs. In an environmental context, it also explains why and how European cities will see air pollution levels and greenhouse gas emission targets reached much sooner – or face significant fines for breaching those levels.


Key Quotes:

“..cities [in Europe] welcome new shopping malls and apartment buildings but severely restrict the allowable number of parking spaces. On-street parking is vanishing. In recent years, even former car capitals like Munich have evolved into “walkers’ paradises”..Carless households [in Zurich] have increased from 40 to 45 percent in the last decade, and car owners use their vehicles less, city statistics show”

“Closely spaced red lights have been added on roads into town, causing delays and angst for commuters. Pedestrian underpasses that once allowed traffic to flow freely across major intersections have been removed..Driving is a stop-and-go Experience..That’s what we like! Our goal is to reconquer public space for pedestrians, not to make it easy for drivers…Zurich’s planners continue their traffic-taming quest, shortening the green-light periods and lengthening the red with the goal that pedestrians wait no more than 20 seconds to cross”

““In the United States, there has been much more of a tendency to adapt cities to accommodate driving..Here there has been more movement to make cities more livable for people, to get cities relatively free of cars.”

“Built for the most part before the advent of cars, their narrow roads [in Europe] are poor at handling heavy traffic. Public transportation is generally better in Europe than in the United States, and gas often costs over $8 a gallon, contributing to driving costs that are two to three times greater per mile than in the United States”

“European cities also realized they could not meet increasingly strict World Health Organization guidelines for fine-particulate air pollution if cars continued to reign”
Enhanced by Zemanta