Showing posts with label parking. Show all posts

Thursday, March 31, 2016

Does the End of Privately-Owned Cars Mean the End of Parking ?

The High Cost of Minimum Parking Requirements (27 page pdf, Donald Shoup, Transport and Sustainability, 2014)

Also discussed here: Autonomous cars and the end of parking (Scott Forman, sjforman, Feb 21. 2016)

Today we review an intriguing column that looks at the problem presented in many cities by mandated indoor parking requirements and outdoor parking spaces that create as much as 40% of the paved urban surface area- as well as requiring the use of carbon-based asphalt in their construction and maintenance and an added building cost of $32K per space. One result of autonomous, self- driving cars could be no need for parking spaces, especially privately-owned ones, as the robot cars will continue to move around the city to meet demand and, when not needed, will simply drive to unused parking spaces in the outskirts.  Talk about killing two birds with one stone- end vehicles emissions with electric robot cars and make much better use of the wasted space now solely dedicated to parking.

LAPARKING CRATER

Key Quotes:

“As of today, there are something on the order of 250 million cars in the United States alone. There are also around 800 million parking spaces.”

“in most American cities, parking is actually required to be provided, with complicated formulae depending on land use. A new residential unit might require 2 parking spaces. An office building might require one for every worker.”

“Minimum parking requirements increase the cost of constructing a shopping center by up to 67 percent if the parking is in an above-ground structure and by up to 93 percent if the parking is underground.

“In suburban Seattle, parking requirements force developers to spend between $10,000 and $14,000 per dwelling to provide unused parking spaces”

“the average cost of constructing an underground garage in Boston is $95 per square foot, and the average space occupies 330 square feet, so the average cost of a parking space is $31,000 ($95×330). Across the 12 cities, the average cost per space ranges from a low of $26,000 in Phoenix to a high of $48,000 in Honolulu, with an overall average of $34,000 per space”

“taking an autonomous car everywhere you would normally drive is cheaper than owning a car yourself. It’s also much more convenient — because you don’t have to — you know — actually drive. Which, if you think about it, is kind of an absurd activity. You also don’t have to park.”

“If we end private car ownership we effectively end the need for parking. Fleets of autonomous vehicles should be in more-or-less constant motion when demand is high. And when they’re stationary, they can easily wait in marginal places — under freeway overpasses, on the outskirts.”

“in cities, we should only need about 1/10th as many autonomous cars as we currently have private ones.”

Tuesday, May 5, 2015

How Are Two Waterlocked Cities (Hong Kong and Ottawa) Coping with Traffic Congestion?

Report on Study of Road Traffic Congestion in Hong Kong (124 page pdf, Transport Advisory Committee, Dec. 2014)

Also discussed here: Hong Kong report proposes electronic road pricing (Road pricing, Feb. 19, 2015)

And here: Segregated Bike Lane Pilot Project (City of Ottawa)

And here: Feasibility Study for a Downtown Ottawa Truck Tunnel (City of Ottawa)

And here: Premier Wynne, MP Galipeau and Mayor Watson tour progress of Confederation Line tunnel (City of Ottawa, Aug. 11, 2014)

And here: How Congested with Traffic are Canadian Cities? (Pollution Free Cities, Jul. 7, 2014)

And here: Is It Time for Congestion Pricing in Canada’s Capital? (Pollution Free Cities, Mar. 22, 2013)

Today we review a comprehensive report by authorities in Hong Kong on measures that could be taken in the short and long term to ease traffic congestion which is having major impacts on economic activity by slowing mobility and as well as to the air quality of this large city where the number of vehicles has increased by 30% over the last decade to almost 700,000 while average vehicle speed has slowed by 11% to 22 kph in the urban area. One of the first steps taken by the working group was a poll of public views on the causes for the congestion – the top three according to a majority of those polled were: too many vehicles on roads, too much road work and illegal parking. The measures recommended included ones to strengthen public transit (by offering more options for pedestrians), ones to discourage traffic interruptions by illegal parking and by tourist buses, trucks or vans operating at rush hour (by giving more enforcement powers to police) and ones to reduce the number of cars on the roads by a electronic road charging system. The Hong Kong authorities also are constructing a tunneled bypass highway as an option to the roads being considered for tolling.

Many of the causes identified for congestion and the options being considered are, to this reviewer, very similar to conditions in Canada’s national capital. Although different in many ways, Hong Kong and Ottawa have similarities, especially in terms of high traffic volumes and pollution hot spots and the fact that both urban cores are surrounded by water and so are not able to expand to accommodate more and more traffic. Vancouver, British Columbia is another city almost entirely surrounded by water which has managed to overcome some of the congestion problems that hamper Ottawa and Hong Kong- not allowing a freeway through its centre and providing mobility options being some of its major accomplishments to lead the list of world cities with the highest environmental quality and quality of life. Singapore is another example of a waterlocked city that attacked its traffic congestion with electronic road tolling and was one of the first in the world to do that successfully (as is being recommended for Hong Kong).

Ottawa, like Hong Kong, has more than 600,000 registered vehicles on the road converging each day into the smallest Central Business District of any large city in the country and major road works (a downtown town tunnel to remove heavily polluting diesel trucks from city streets and a second tunnel for Light Rail Transit) are underway in the core which is guaranteed to disrupt traffic further. Recent feeble efforts to accommodate pedestrians, such as a pedestrian bridge over the canal (one done, another planned) and to offer some protection for cyclists with an 8 block segregated/curbed bike lane through the downtown core need to be expanded, along with improvements in non-polluting public transit for the whole city (now planned for 2030). A close read of the Hong Kong report by Ottawa city transportation planners is warranted.

 hong kong  

Key Quotes:

“Recurrent causes of road congestion:

“(a) limited scope for more road transport infrastructure; (b) excessive number of vehicles; (c) competing use of road space; (d) management and enforcement issues; and (e) road works.”

“The number of total licensed vehicles grew by about 30% from about 524 000 in 2003 to about 681 000 in 2013, with an annual growth rate of 3.4% in recent years. The larger the vehicle fleet size, the slower the car journey speed in the urban areas.. During the same period, the average car journey speed in urban areas dropped by about 11% from 25.6 km/h in 2003 to 22.7 km/h in 2013”

“Government has put in place measures to promote non-mechanised means to commute, e.g. through building hillside escalators and improving pedestrian facilities to enhance walkability and connectivity.”

“Motor vehicles are the main source of air pollutants at street level and the second largest source of greenhouse gas emissions in Hong Kong.”

 “if we do nothing now, with an assumption that the current PC growth rate of about 4.5% p.a. is to continue, it is estimated that the average journey speed in urban areas would be decreased by about 15% in 10 years’ time, with the amount of greenhouse gases generated increased by more than 20%.”

 "Recommendations:
Short-Medium Term

A. Managing the PC fleet size
• Raise PC’s First Registration Tax and Annual Licence Fee Tighten up standards for EFPPCs <Environment-friendly Petrol Private Cars>
 • Raise “fuel levy” for diesel PCs

B. Efficient use of limited road space
• Start planning for a congestion charging pilot scheme
• Increase meter parking charges(The maximum fee for metered parking is $2 per 15 minutes (equivalent to $8 per hour)

C. Stringent penalty and enforcement of traffic offences
• enhance publicity and education efforts to promote compliance with traffic rules and regulations raise the fixed penalty charges for congestion-related offences to restore the deterrent effect (current fixed penalty charges are set at $320 or $450 for congestion-related offences, such as illegal parking
• adopt a stricter approach and deploy more resources to enforce congestion-related offences by the Police • make further use of information technology in enforcement Long-term measures
 * Review parking policy and disseminate real-time information on parkingVacancies
* Encourage on-street loading and unloading outside peak hours
* Provide more park-and-ride facilities"

Thursday, September 4, 2014

Does “Free” Parking Downtown Make Any Sense?

How to Tax Parking (And How Not To) (Transport Providence, July 8, 2014)

Also discussed here: What’s the Best Way to Tax Parking? (Angie Schmitt, StreetsBlog, Jul. 25, 2014)

And here: Parking Taxes - Evaluating Options and Impacts (21 page pdf, Todd Litman, Victoria Transport Policy Institute, Aug. 29, 2013)

Today we review a blog post that discusses the equity or fairness in how parking spaces and lots are taxed, noting that many parking lots next to stores offer “free’ parking and these are taxed at a lower rate. A better approach from a fairness and environmentally wise point of view is to tax all spaces at the same rate. Parking rates are key to lowering congestion as well as discouraging casual use of roads by cars in the downtown- and as we see in San Francisco (SfPark), applying varying parking rates according to demand goes even farther.

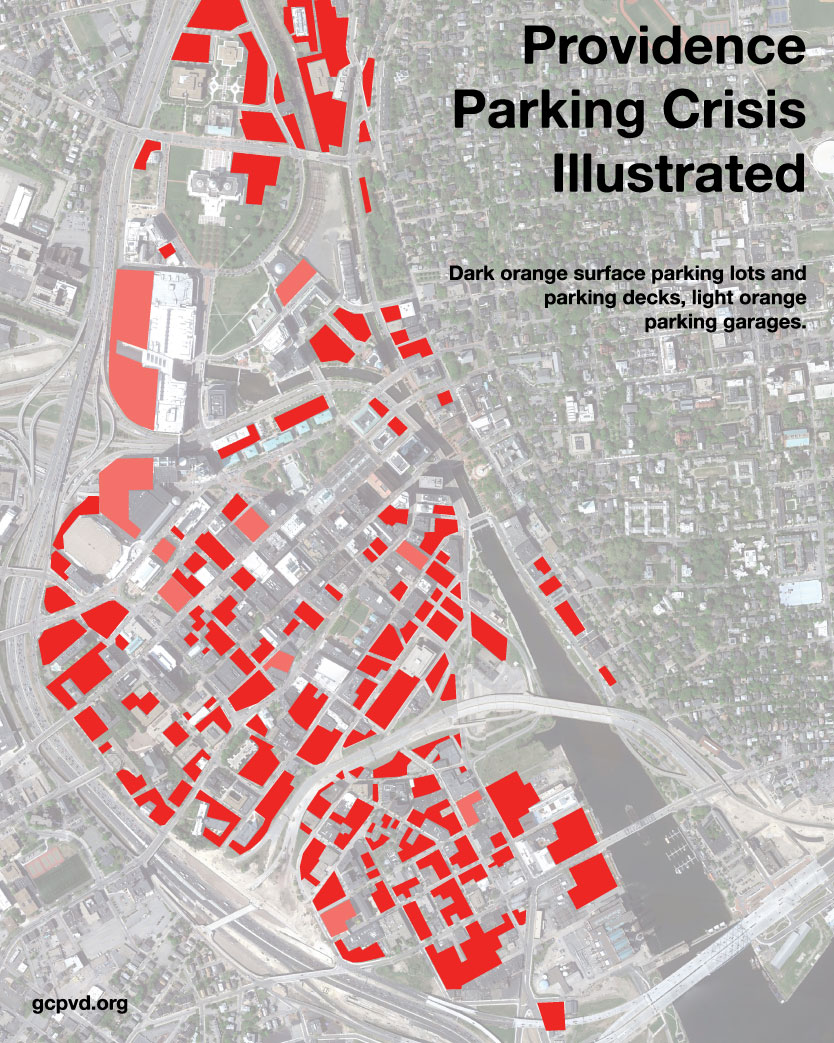
 providence parking 

Key Quotes:

“it's politically easiest to tax parking on dedicated lots, rather than to do a "per space" tax on all parking, but this way of taxing parking has problems”

“the lot parking attached to businesses is free to customers and employees. Of course, it's not actually free. It costs money which is passed into lost wages or higher prices. But to the worker or consumer, it appears free.”

 “When the price of commercial parking, i.e., the lots downtown that charge per hour, becomes more expensive without putting an equal burden on these other parking lots, it gives a stronger incentive for businesses to include free parking into their design as a benefit to customers or workers. This is not what we want.”

“Providence's smallest (by area) businesses produce the most revenue for the city per acre, while those that appear to be the anchor businesses often produce much lower revenue per acre.”

“when we set a parking tax, it should be per parking spot. This is a fair tax, because businesses are free to choose whether the cost of parking is worth it to them in a market, or if they'd like to trade some of that cost away for greater infill development”

"A parking tax is fair in a market sense because it puts a value on things that are actually consumed by drivers…it allows funds that are currently being used to prop up car ownership to be repurposed--either through an expanded market for housing, lower prices on rents; or even in expanded services, such as better spending on schools. It makes sense in an environmental sense because it helps us to achieve green goals”

Wednesday, July 23, 2014

How Well Does San Francisco’s Smart Parking System Perform?

Does San Francisco's Smart Parking System Reduce Cruising for a Space? (Eric Jaffe, The Atlantic City Lab, Jun. 25,2014)

Also discussed here: SFpark Project Evaluation Presentation (24 page pdf, San Francisco Municipal Transportation Agency, Jun. 19, 2014)

And here: SFpark Evaluation Shows Parking Easier, Cheaper in Pilot Areas (SFMTA Press Release, Jun. 19, 2014)

Today we review an evaluation of the project in San Francisco which introduced a modern parking pricing system in 2011 that raises (or lowers) parking charges according to demand and monitors in real-time when spaces are vacant or occupied. Results indicate that the project was successful in maximizing occupancy of parking spots and reducing the amount of needless circling by drivers looking for an empty spot(by 30%) - and as a result reduced the amount of fuel consumed and CO2 emitted (by 30%) - all while reducing the average hourly parking charge applied (from $2.69 to $2.58) and the number of citations issued (by 23%). One negative result was that over time the availability of parking spots at peak demand did not result as expected from the increased rates charged which leaves the management of rates and availability for further study. Coming next is application of smart metering to off-street parking lots and buildings.

 SF parking meter  

Key Quotes:  

“SFpark changes meter rates based on parking demand to maintain an average occupancy between 60 and 80 percent: When parking on a street is too full (or too empty), the hourly price goes up (or down) to free up (or fill up) spaces.”

“On average over the year of the study, when meter rates rose $1 per hour, occupancy fell 10 percent (and when rates fell $1 per hour, occupancy rose 7 percent).”

“Benefits:
  • Average on-street meter rates dropped by $0.11 per hour, or 4 percent;
  • Average garage rates dropped by $0.42 per hour, or 12 percent;
  • Target occupancy of 60-80 percent was met 31 percent more often;
  • Blocks were full (i.e., no available parking) 16 percent less often;
  • Average time spent searching for parking decreased by 5 minutes, or 43 percent;
  • Meter-related citations decreased by 23 percent; and
  • Vehicle miles travelled and greenhouse gas emissions from cars circling for parking decreased by 30 percent.”
“By making it easier to park and easier to pay, we have significantly reduced parking tickets and improved the experience for people who visit, live in, or work in some of San Francisco’s busiest commercial neighborhoods,”“San Francisco’s population and economy grew over the last three years and even as more and more people came to the city, we were able to reduce circling for parking and make the streets safer for everyone.”

“Strategies included:
  • Demand-responsive pricing;
  • Adding credit and debit card-enabled meters as well as pay by phone to make it easier to pay for parking;
  • Longer time limits at meters;
  • Real-time information about on- and off-street parking availability; and
  • Static wayfinding signs to garages.”
“The study raises a good question about whether occupancy or availability is a better measure of smart parking success. From a driver's perspective, availability is almost certainly more important. Far better to know that a spot will always be open, whatever the price, than to leave the house wondering.”

Monday, July 21, 2014

Calgary’s Response to Downtown Congestion: Price Parking by Demand

Calgary's demand-responsive on-street parking pricing (Paul Barter, Reinventing parking, Jun. 13, 2014)

Also discussed here: MBA: The Right Price for Parking (Elizabeth Press, including a 3 minute video,Street Films, Apr. 19, 2011)

And here: Demand-responsive parking prices: a key element of Adaptive Parking (Paul Barter, Reinventing Parking, Jan. 14, 2012)

And here: Parking in Calgary

Today we highlight a system that varies the charges for parking by demand (or parking pricing) , just introduced in downtown Calgary, Alberta. The approach uses the principles espoused by Prof Shoup and implemented in San Francisco in 2011 where the price for parking varies block by block according to the demand for parking as measured by sensors in the parking space pavement. In Calgary, prices for parking are applied not by block but by defined parking areas where prices increase by 25 cents/hr when the spaces are occupied more than 80% of the time and lowered when the occupancy rate is less than 50%. Experience from other cities indicates that revenue from such an approach can double or triple that from fixed rate parking meters, in addition to reduced congestion and improved air quality in the downtown core from fewer vehicles driving needlessly to find a vacant parking spot.

 Calgary am price adjustment map  

Key Quotes:

"the right price is the lowest price you can charge and still have one or two spaces available on each block."

“Depending on the demand for parking at a given location, the right price could be higher or lower than the static prices you see at traditional meters. You need a dynamic system that adjusts the price based on demand.”

“Rates will be adjusted by a maximum of $0.25 per year according to demand. Specifically:
  • In areas where occupancy is below 50%, prices will decrease by $0.25;
  • In areas where occupancy is above 80%, prices will increase by $0.25;
  • In areas where occupancy is between 50-80%, prices will stay the same.”
 

Thursday, April 3, 2014

Why Do We Subsidize Parking for Public Transit Users?

The Dirty Truth Behind Park & Rides (Matt Steele, StreetsMM, Mar. 18, 2014)


Today we review some suggestions from Minneapolis where the proposal to expand their park and ride facilities is assessed in terms of what it costs to give the parking away free (when it costs $10 per user) compared to other more cost effective options, such as doing away with higher express fares at peak use times or producing more revenue from the lot areas than giving away parking. Bottom line is that the number of extra riders and revenue produced by free parking is less than improvements to the transit system itself which would make the latter more efficient and double the net revenue. A good question whether this arguments holds for cities such as Ottawa that are sprawled out over more than 2,800 km2 where some suburban and rural areas are poorly or expensively served by public transit. But it is always useful to consider impacts on ridership and the costs of subsidies in running very expensive public transit systems.

   parka nd ride  

Key Quotes:

 “For less than the cost of two Maplewood park & rides serving up to (2×580=) 1160 parked cars, we’re building a full Arterial BRT line on Snelling Avenue scheduled to open next year. Those improvements will serve an estimated ridership of 8,700. And, unlike additional parking spaces, these amenities serve all riders (not just the 3,000 new ones). This is 7.5 times more productive than the same investment in parking.”

“If the new Maplewood Mall ramp capital is amortized over a 20 year period, we’re spending roughly $1200 per space per year to have the capacity for 580 new park & riders. At 240 workdays a year, a $5 parking fee would be necessary just to pay off the investment. $5 per person in addition to the transit fare to operate the bus. A $5 parking fee which wouldn’t even pay for maintenance, snow removal, and lighting – so let’s bump that up to $7.”

 “Modern technology allows us to decouple parking costs from other costs, which is the first step. The near-ubiquity of GoTo cards (especially on commuter routes) allows for us to have a fast way to account for parking transactions, possibly with an RFID-equipped entry gate or a validation match to a parking space.”

“The second step is to eliminate the express fare for those who do not consume parking spaces.” “Suburban park & riders are clearly not paying $9.50 to park before paying an additional fare to get on the bus. Someone else is paying to subsidize their car storage habits. And you’re it.”
Enhanced by Zemanta

Wednesday, April 2, 2014

Do Cities Cater to Car Drivers or to Pedestrians? At what cost?

Walkable City: How Downtown Can Save America, One Step at a Time [Kindle Edition] (321 pages, Jeff Speck, Nov. 13, 2012)

Also discussed here: The walkable city (17 min. video, TED, Sep 2013)

And here: Canada's Most Walkable Cities 2010 (WestJet Up magazine, Apr. 9, 2010)

And here: Parking (Paul Fritz, smalltownurbanism, Feb. 28, 2014)

 Today we review a book by Jeff Speck called the Walkable City which surveys the design of cities when to comes to walkability and the trend toward driving and away from walking in many cities. He points out that among other things, that large surface areas dedicated to parking spaces and taken away from pedestrian malls and urban parks is a prime obstacle to a city’s walkability. There are reasons why cities such as New York, Boston and Portland in the USA or Vancouver or Victoria in Canada are seen as more pedestrian friendly than Dallas or Winnipeg. The measurable impacts are clear as well: obesity and the risk of diabetes is directly related to lack of walkability; the number of car crash deaths is around 12 deaths per 100,000 in the USA compared to 3 in Japan and in walkable cities such as New York and San Francisco (both of which have made great strides in promoting cycling and car free and by pricing parking by demand).

 areas    resised_Shopping_in_GastownTourism Vancouver and John Sinal  

Key Quotes:

" In Walkable City, he persuasively explains how to create rational urban spaces and improve quality of life by containing the number one vector of global environmental catastrophe: the automobile." (David Owen, staff writer at The New Yorker and author of Green Metropolis)  

“When creating a walkable urban environment, it is extremely important to ‘get the parking right’, and many of our communities have been getting it wrong for decades at the expense of the pedestrian.”

“Parking is expensive to construct, especially when it is structured parking, and maintain. A space in a surface parking lot on inexpensive land costs about $4,000 and parking space in a structured parking garage can cost over $15,000 per space”

“Parking, they suggest, should be priced such that the cost of parking should be set at a level such that an occupancy rate of 80% is established. This would allow that 1 or 2 spaces per block would be available at all times which would reduce the amount of time (and gas) people spend looking for parking.”

“in the '70s, one in 10 Americans was obese.Now one out of three Americans is obese,and a second third of the population is overweight.Twenty-five percent of young men and 40 percent of young women are too heavy to enlist in our own military forces…fully one third of all children born after 2000 will get diabetes.We have the first generation of children in America who are predicted to live shorter lives than their parents”

“If you lived in a more walkable neighborhood,you were 35 percent likely to be overweight.If you lived in a less walkable neighborhood,you were 60 percent likely to be overweight”

“in America, 12 people out of every 100,000die every year from car crashes…in England, it's seven per 100,000.It's Japan, it's four per 100,000.Do you know where it's three per 100,000?New York City.San Francisco, the same thing. Portland, the same thing… if your city is designed around cars,it's really good at smashing them into each other”

“the average Manhattanite is consuming gasoline at the rate the rest of the nation hasn't seen since the '20s,consuming half of the electricity of Dallas…Canadian cities, they consume half the gasoline of American cities.European cities consume half as much again”

“Canada's Most Walkable Cities 2010:
  1. Vancouver
  2. Victoria
  3. Montreal
  4. Toronto
  5. Halifax
  6. Quebec City
  7. Ottawa
  8. Calgary
  9. St. John's
  10. Winnipeg”
   
Enhanced by Zemanta