Friday, October 29, 2010

Heating Urban Areas with Geothermal Energy


Urban heat island profile
Image via Wikipedia


The geothermal potential of urban heat islands (7 page pdf, Environmental Research Letters, Volume 5, Number 4, Oct. 12, 2010)

Geothermal energy sources have long been seen as a way of heating (and cooling) buildings, one of the main sources of greenhouse gas emissions when carbon fuels are used. The urban heat island effect is sometimes confused with the impact of climate change on urban temperatures rather than as the additional impact that it represents. The article reviewed today comes as a welcome relief in two ways: by suggesting that the geothermal energy impact itself can be harvested for use as a carbon-free source of building heat, and by showing that the longer term historical impact of the urban heat island is to accentuate the value of it as a heat source.


Key Quotes:

“Factors that cause the urban heat island effect in the subsurface are similar to the ones that increase surface air temperature, such as indirect solar heating by the massive and complex urban structures, anthropogenic heat losses, and land use change… because rather than radiation and advection, slow conduction plays the most important role in underground heat flow, and it is influenced by both surface and subsurface processes.

“The extra heat stored in urban aquifers is sometimes considered as a kind of underground thermal pollution. However, as a result of increasing interest in geothermal use, these high yielding aquifers are attractive thermal reservoirs for space heating and cooling”

“the theoretical geothermal potential in the urban aquifer of Cologne has a space heating capacity of 2.5, which means that the minimum potential extractable heat content is at least 2.5 times the total annual residential heating demand..Winnipeg’s heating demand is almost twice that of Cologne and its population is smaller. Accordingly, its geothermal potential is at least half of the annual heating demand, and a maximum capacity of 5.6”

“Cities with a longer history of urbanization usually have influence on the subsurface temperature at greater depth, due to the early start of additional heat”


Enhanced by Zemanta

Thursday, October 28, 2010

Can a Distance Based Tax Replace the Gas Tax?

Miles Not Gallons Could Be Key to Road Upkeep (The Idea Lobby, Oct. 6, 2010)


Also discussed here: Chapter 3. Vehicle-Miles Traveled (EIA Transportation)

Today’s review article looks at a more effective way of assessing road users for the cost of maintaining roads than by the existing gas tax which does not distinguish between the weight or distance traveled of these vehicles. More sophisticated than a gas tax but not as expensive as road tolls, a simple and routine monitoring of distance travelled is suggested, using modern uploading of the data at convenient locations.

Key Quotes:

“As we need less gas to get from point A to point B, less revenue is generated by the gas tax that paves the road between those two places.”

“the advancements we cheer in hybrid technology and electric batteries are going to make it increasingly difficult to fix things.”

“Tying the funding of our transportation system to a tax levied on a commodity, the consumption of which we’re trying to discourage, is probably not the best way to go,”

“The technology currently exists — and has been tested in some pilot programs — to upload your odometer reading at, for instance, a fixed location like a gas station”

“The fee could be adjusted for the weight of your vehicle (heavy trucks are, in a way, greater “users” of the highway system than are motorcycles), or according to the time of day you travel. Innovative toll systems that charge variable rates in off-peak and rush hours have been popular with many drivers..because they manage traffic in a way that gets everyone around more efficiently”

Enhanced by Zemanta

Wednesday, October 27, 2010

Moving toward a Car-Free City

Cars at Curbside, Available to Share (New York Times, July 16, 2010)

Also dicussed here: Surrender Your Permit (City of Hoboken, NJ)

And here:  Corner Cars (City of Hoboken, NJ)


Car-sharing by the hour has taken another step forward with the innovative scheme implemented in Hoboken, NJ where the city actually pays someone to give up the parking permit for their car (and hopefully their car as well). Typically, a car used in a car sharing operation is used by 15-20 people, as opposed to the private car –single user. Reducing the number of cars in a city which car sharing along with alternative modes such as public transit, cycling and walking will accomplish, has two main and positive impacts on urban life and environment: on the one hand, it reduces congestion and the paved storage areas needed for 90% of the day for private vehicles- both on and off street- and on the other hand, less emissions from the total vehicle population and improved air quality.
Key Quotes

“The program, called Corner Cars, is based on the rent-by-the-hour model that companies like Zipcar and Hertz have been offering for years...  Sign up online to get an electronic card in the mail. Then make your reservation, find your car in its assigned space, wave your card by a reader mounted inside the windshield and head off.... Hoboken’s shared cars are parked on the street, in special bright green spots that appear every few blocks so they are never far out of sight or mind”

“Surveys have shown that for each of these vehicles in Hoboken, over 17 households have given up their cars! An additional 20 or more households have said they delayed or avoided buying a car because of access to these cars… The first wave of this program includes about 50 Corner Cars, so we expect to see over 750 cars removed from the streets!”

“What is it about car sharing that causes people to sell their cars or forfeit a car?..a growing culture of sharing of “social networks and the creation of communities through instant information…Mr. Vanderbilt likened it to the difference between paying to acquire and “park” a huge collection of CDs and simply streaming the music you want, when you want it, from the Internet.”


Enhanced by Zemanta

Tuesday, October 26, 2010

Why are Canadian Cities Tops for Transit?

Request for Information: Canadian Ridership (Human Transit, Oct. 7, 2010)

Also discussed here: Further cause for Canadian Triumphalism (Human Transit, Oct. 8, 2010)


This post on Jarrett Walker’s Human Transit blog is quite striking from the point of view, at least, of this Canadian blogger (in Ottawa, no less) who despairs of the apparent lack of use of public transit and addiction to cars for commuting – and here we are top of the heap!

Jarrett asked why? – when Ottawa, followed closely by two other sprawled, relatively low population density cities, Edmonton and Calgary, ranks higher than larger cities  such as Vancouver – or Melbourne and Sydney in Australia. My guess, as a meteorologist, is the cold climate at these three cities which reaches a peak at the same time as transit demand peaks because of work and school and with mid-winter temperatures as low as minus 40 (in either Fahrenheit or Celsius) – and at those temperatures, cars sometimes don’t start, so that the bus is the only way to get to work. Average mid winter “normal” temperatures were extracted for some of the cities noted in the graph (see below) from the climate archives in Canada and Australia.  Clearly, Canadian cities in January are much colder than in Australia with one third of the days with minima below –20 deg C, while Australian cities are basking in temperatures in the mid teens - do they even know what snow is? This theory does not work in Ozland- there must be something else  to explain why Melbourne riders use transit so much more than in Perth.

http://www.bom.gov.au/climate/data/index.shtml?

http://www.climate.weatheroffice.gc.ca/climate_normals/index_e.html

City                  Average Winter            trips/cap/yr      Days below –20C

Max Temp(C)

Ottawa                 -6.1                              165                            9

Calgary               -2.8                              145                           9.2

Edmonton            -8                               140                        12.8

=====================================

Melbourne            13                                125

Sydney                    17                               110

Adelaide               14.9                              60

Perth                      17.9                             75
Enhanced by Zemanta

Monday, October 25, 2010

Traffic, Air Pollution and Breast Cancer


Age-standardised death rates from Breast cance...
Image via Wikipedia


Postmenopausal Breast Cancer is Associated with Exposure to Traffic-related Air Pollution in Montreal, Canada: A Case-Control Study (35 page pdf, Environ Health Perspect doi:10.1289, Oct. 6, 2010)


Key Quotes:

“Breast cancer has the highest incidence rate of all cancers in women and is the second leading cause of death from cancer in both Canada .. and the United States”

“to determine whether the incidence of postmenopausal breast cancer in Montreal, Quebec, was associated with exposure to intra-urban concentrations of nitrogen dioxide (NO2), a marker for traffic-related pollution.. Montreal is the second largest city in Canada, with the greater Montreal area having a population over 3.6 million people”

“NO2 is recognised as a marker of traffic-related pollution due to its co-locational association with other pollutants .. placed samplers in areas likely to have high spatial variability in traffic-related pollution and high population densities”

“we found an increased risk of approximately 25 percent for every increase of 5 ppb in exposure.”

“We found an association between exposures to traffic-related air pollution and the incidence of postmenopausal breast cancer in a city that by international standards is relatively unpolluted”

“Our analysis of occupational exposures suggests that exposures to some compounds before the age of 36 may be more important.”


Enhanced by Zemanta

Friday, October 22, 2010

Health Risks of Living near Traffic

Urban planning could cut air-pollution woes (Environmental Research Web –news, July 22, 2010)

Also discussed here: Healthy Neighborhoods: Walkability and Air Pollution (8 page pdf, Environ Health Perpect 117(11), Nov. 2009)

And here: Traffic-related air pollution as a risk factor for the development of childhood asthma (14 powerpoint slides, AllerGen, Dec 16-18, 2009)

And here: Traffic-related air pollution as a risk factor for the development of childhood asthma (32 page pdf, AllerGen, Spring 2010)


Key Quotes:

“They’ve mapped people’s exposure to eight major pollutants – CO, NO, NO2, SO2, ozone, PM2.5, PM10 and black carbon – according to post code, and used medical records to analyse the link with health”

“results showed that “mums-to-be” who lived within 50 m of a major road were 26% more likely to have a low-birth-weight baby and had a greater chance of a premature birth, compared with women living more than 50 m from a major road”

“This then puts children at increased risk for a large number of health problems throughout their lives.. children living near busy highways were 13% more likely to develop asthma, 6% more likely to develop bronchiolitis and around 8% more likely to experience middle-ear infections.”

“We show that people who move away from high-traffic roads reduce their risk of cardiovascular-disease death compared with people who do not.. people who move from within 50 m of a major highway reduce their risk by 45%”

“Within cities, careful urban and transport planning, such as setting roads back from pavements, improving accessibility for cyclists and pedestrians, having dedicated truck routes and congestion charging can make an immense difference”


Enhanced by Zemanta

Thursday, October 21, 2010

Impact of Air Pollution on Mortality in Canadian Cities


View of Centre Block and Library of Parliament...
Image via Wikipedia


Estimated Number of Excess Deaths in Canada Due To Air Pollution (10 pages, Air Health Effects Division, Health Canada, and Meteorological Service of Canada, Environment Canada, Gatineau, Quebec, April 2005)

Key Quotes:

“the annual number of excess deaths due to current air pollution levels in Canada.. associated with both short- and long-term exposure to air pollution”

“based on nonaccidental mortality counts and National Air Pollution Surveillance data ..and pollutant-mortality concentration response functions from epidemiological studies”

“The annual excess number of deaths associated with short-term exposure was estimated to be 1,800.. with long term exposure was estimated to be 4,200.. results in a total excess deaths estimate of 5,900”


Enhanced by Zemanta

Wednesday, October 20, 2010

The Cost of Sprawl and the Benefits of "Growing Smart"

Smart Growth will help California avoid air pollution-related illnesses, deaths and costs (American Lung Association in California, Sept. 16, 2010)


Key Quotes:

“data shows health benefits, including reduced asthma attacks and premature deaths linked to the Vision California “mixed growth” and “growing smart” scenarios in 2035 that include more compact, sustainable development patterns.

“compares a “Business as Usual” scenario, which assumes a continuation of dispersed, auto-oriented development patterns, with “Mixed Growth” and “Growing Smart” scenarios, which assume more balance in the housing mix and greater transportation options”

“If doctors and other health experts designed our cities, they would look quite different than the sprawling communities we see today,”

“Cities would provide more healthy choices, more opportunities for walking and biking, better access to transit, less congestion, more housing close to workplaces and more parks for kids and families to enjoy.”


Enhanced by Zemanta

Tuesday, October 19, 2010

The Case for Free Public Transit


TTC Streetcar at Neville Loop
Image via Wikipedia


Should All Public Transit Be Free? (Big Think- Think Tank, Oct. 1, 2010)

Also discussed here: Wellbeing Lower Among Workers With Long Commutes (Gallup, Oct. 1, 2010)

And here: “fare-free would "create a tipping point toward more people using public transportation" (Free Public Transit-The beginning of the end of autosprawl, Oct. 1, 2010)

And here:  “Free roads? Why not free transit?” (Toronto Star, Sept. 14, 2010)

And here:  Everyone benefits - Everyone pays (Free Public Transit, Oct. 1, 2010)

And here: Free Public Transport


Today’s review looks at a post that examines the overall benefits of free public transit, especially in cities which are faced with sprawl. Long commutes are less healthy, as the poll results show above. Point made is that some cities already provide free transit to selected groups with good results. Extending this to the general population would produce even greater benefits to the society served. Onerous fare charges, even those that are priced a bit lower than car commute costs, discourage the use of public transit and indirectly contribute to the air pollution and health problems in many cities.

Key Quotes:

“longer commutes have been linked with severe health problems, according to a recent report by Gallup

“we already pay close to 50 per cent of transit operating costs through taxes, why not go all the way and pay the full cost – it could be the cheapest way to give everyone equal access to transportation”

-benefits of free public transit- some “positive externalities”:

  • "Reduced air pollution, including especially reduced greenhouse gases"

  • "More efficient labor markets since it is easier for poor people to get to jobs"

  • "Health benefits: reduced asthma and other illnesses linked to automobile generated pollution"

  • "Less congestion on the highways for those who do need to drive"


“College towns have been a testing ground for free-ride transit.. Other transit systems have free-fare programs for children, students and the elderly”

"public transportation has to be paid for..not through the purchase of tickets by individual riders—it should be paid for by society as a whole through the one mechanism we have available for this, taxation"

"This should not be thought of as a 'subsidy' in the sense of a transfer of resources to an inefficient service in order for it to survive..but rather as the optimal allocation of our resources to create the transportation environment in which people can make sensible individual choices between public and private means of transformation that reflect the true costs of these alternatives."


Enhanced by Zemanta

Monday, October 18, 2010

Traffic, Pollution and Health- Literature Review


Automobile exhaust gas. White exhaust gas is m...
Image via Wikipedia


Road-traffic pollution and asthma – using modelled exposure assessment for routine public health surveillance (7 page pdf, International Journal of Health Geographics, Oct. 14, 2004)


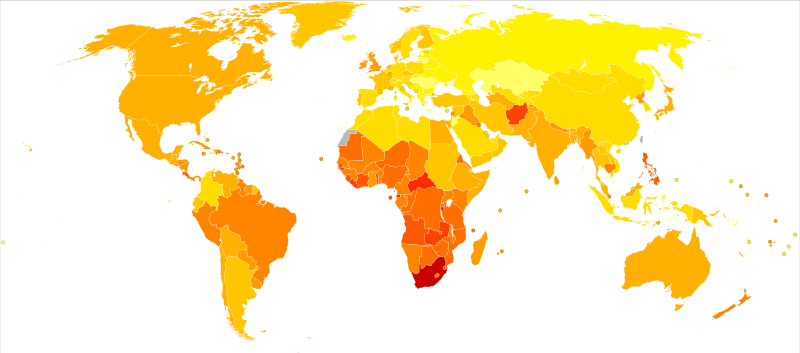
Age-standardised disability-adjusted life year (DALY) rates from Asthma by country (per 100,000 inhabitaants)

Key Quotes:

“almost 50% of NO 2 is thought to be produced by vehicles and much particulate matter is produced by diesel exhaust fumes”

“Heavy traffic flow has also been shown to increase childhood asthma admissions.. those living within close proximity to a road are also at an increased risk of hospitalisation with asthma”

“[public health]Policy implications might include routing of traffic, construction of bypasses, congestion reduction schemes, utilisation of non-fossil fuel cars and possibly even the location of schools”

“A monitoring system would use estimates of air pollution from road traffic which would be linked to data on asthma obtained from routine systems, such as hospital admissions, attendance at accident and emergency departments or primary care consultations or to data from periodic surveys on health, including asthma prevalence”

“[exposure assessment]comparing asthma prevalence in areas designated as high and low pollution areas, using distance from main roads as a proxy for exposure to road traffic pollution, using traffic counts to estimate exposure, using vehicular miles travelled and using modelling approaches which can take into account a number of variables”

“meteorological conditions can alter dispersion of pollutants. It is well known that cold weather conditions trap air close to the ground, prolonging the duration of the time pollutants remain close to where they were produced”

“Part IV of the Environment Act 1995 requires a local authority to designate an Air Quality Management Area (AQMA) covering any part of its administrative area where air quality objectives are not likely to be achieved by, or at any point beyond, the relevant objective's target date at locations where the general public might reasonably be exposed.. Local authorities are not statutorily obliged to meet the objectives, but they must show that they are working towards them”

“A routine surveillance system recording spatial variation in pollutant levels..would allow local policy decisions concerning the routing of traffic around residential areas or schools and plans to reduce congestion to be made with knowledge of the implications of the decision on the health of the local population”


Enhanced by Zemanta

Friday, October 15, 2010

Global Health Impact of Air, Land and Water Pollution


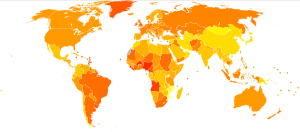
Overview of main health effects on humans from...
Image via Wikipedia


Ecology of Increasing Diseases: Population Growth and Environmental Degradation (Human Ecology, Volume 35, Number 6, 653-668, Dec. 2007)

Also discussed here: Pollution causes 40 percent of deaths worldwide, study finds (Eurekalert, Aug. 13, 2007)

And here: Environmental pollution and degradation causes 40 percent of deaths worldwide, Cornell study finds (Cornell News, Sep. 30, 1998)

Key Quotes:

“An estimated 40 percent of world deaths can now be attributed to various environmental factors, especially organic and chemical pollutants”

  • "Each year, air pollutants adversely affect the health of 4 to 5 billion people worldwide. An expanding world population is burning more fossil fuels, emitting more industrial chemicals and driving more automobiles. The number of automobiles is increasing three times faster than the rate of population growth.”

  • "Of the 80,000 pesticides and other chemicals in use today, 10 percent are recognized as carcinogens. Cancer-related deaths in the United States increased from 331,000 in 1970 to 521,000 in 1992, with as estimated 30,000 deaths attributed to chemical exposure.”

  • "Less than 1 percent of 500 Chinese cities have clean air. Respiratory disease is the leading cause of death in China.”

  • "Although the use of lead in U.S. gasoline declined since 1985, other sources inject about  2 billion kilograms of lead into the atmosphere in this country each year. An estimated 1.7 million children in the United States have unacceptably high levels of lead in their blood.”

  • "The global use of agricultural pesticides rose from about 50 million kilograms a year in 1945 to current application rates of approximately 2.5 billion kilograms per year. Most modern pesticides are more than 10 times as toxic to living organisms than those used in the 1950s"


"A growing number of people lack basic needs, like pure water and ample food. They become more susceptible to diseases driven by malnourishment, and air, water and soil pollutants,"

"Relying on increasing diseases and malnutrition to limit human numbers in the world diminishes the quality of life for all humans and is a high-risk policy"


Enhanced by Zemanta

Thursday, October 14, 2010

London’s Cycle Superhighways

Barclays Cycle Superhighways: Frequently asked questions (22 page pdf, Transport for London, 2010)

Also discussed here: London’s Bicycle Superhighway Opens Today! (Inhabitat, July 19, 2010)


One key way of reducing vehicle emissions comes from shifting the choice for commuting from cars to bikes. This has been encouraged in cities such as Paris, New York, Montreal, Ottawa and other cities with making hundreds of bikes available through bike sharing programs with names such as Bixi, Velib etc as highlighted in Velib Public Bicycles in Paris (Pollution Free Cities, July 23, 2009)

However that often comes with a risk to cyclists’ safety, particularly in cities with heavy traffic, unless segregated bike lanes are in place along the preferred routes commuting and there are safe ways of crossing intersections as described in

Segregated Bike Lanes (Pollution Free Cities, Oct. 12, 2009)

Coming just before the Olympic Games in 2012, London England recently began to implement a “Cycle Superhighway” which addresses some of these concerns. The guide noted from London Transport describes most of the details.

Key Quotes:

“Barclays Cycle Superhighways will provide safe, fast direct and continuous routes into central London from the outer boroughs”

Objectives:

  • Improve cycling conditions for people who already commute by bike

  • Encourage those who don't to take to pedal power and keep fit

  • Help cut congestion

  • Relieve overcrowding on public transport

  • Reduce emissions”


“Painted a bold, bright blue, the cycle highways are 1.5 meters wide and they provide a safer space and more efficient routes for cyclists to travel.”

“London’s new bicycle superhighway network has 12 planned routes in all..The first route, labeled CS7, starts in Colliers Wood, a London suburb, and travels 8.5 miles to the city center along a busy commuter route, while the second one runs from Barking, in east London, to Tower Gateway.”

“TfL has a target of five percent of all trips in London to be undertaken by bicycle by 2025 which presents a 400 percent increase in cycling compared to figures in 2000”

“will be highly visible …cycle lanes will be at least 1.5 m wide and will continue through junctions. Advanced stop boxes will be provided at signals to help get ahead of the traffic”


Enhanced by Zemanta

Wednesday, October 13, 2010

Wireless Roadside Air Quality Monitors

Newcastle University develops wireless air quality monitor (the Engineer, Sept. 23, 2010)

Also discussed here: New Pollution Hotspot Sensor (Sky News video 2 min 20 sec, Jun. 30, 2009)

And here: Mobile Environmental Sensing System Across Grid Environments (MESSAGE web site)

And here: Field deployments of the MESSAGE system for environmental Monitoring (9 page pdf, TEC, Dec. 2009)


Key Quotes:

“A new system that can provide detailed information on air quality in busy cities is being rolled out across the UK.”

“Mobile Environmental Sensing System Across a Grid Environment (MESSAGE).. was developed by researchers at Newcastle University to collect real-time, minute-by-minute, metre-by-metre data on traffic pollutants such as carbon monoxide (CO), nitrogen dioxide (NO2)”

“The aim of this project was to improve our understanding of how pollution accumulates and disperses in our cities and ultimately to inform new traffic management plans that will improve urban air quality and transform the way we travel.”

“The key to our invention is that the devices are small, low cost and completely wireless, making them rapid and cheap to deploy in large numbers. They scavenge energy through solar power and use wireless communication to transfer data back directly to the end users and in real time.”

“we can see exactly where and when problems are occurring and potentially respond to them immediately – for example automatically adjusting traffic signals to reduce congestion in problem areas.”

“Demonstrated for the first time in Gateshead last year, the sensors are now being commercially produced by a newly formed north-east company called EnviroWatch.”


Enhanced by Zemanta

Tuesday, October 12, 2010

Monitoring Local Air Pollution in Ontario


Category:Visitor attractions in Ontario
Image via Wikipedia


Brief Review: Using Air Monitoring as a Tool to Assess & Address Local Airsheds & Micro-Environments in Ontario (66 pages, March 9, 2010, Kim Perrotta for the Environmental Commissioner of Ontario)

Also discussed here: 2009/2010 Annual Report of the Environmental Commissioner of Ontario (232 pages pdf, Sept. 22, 2010)

The report reviewed today, in support of the 2009/2010 Annual Report by the Environmental Commissioner for Ontario, describes the state of air quality monitoring for a number of municipalities in southern and eastern Ontario (Toronto, York, Halton Region, Peel Region, Waterloo, Hamilton, Sudbury, and Ottawa) and how these data may be used for applications, such as urban planning and public health. The Commissioner’s report, in turn, suggested a greater priority for mobile sources that appears to go beyond the present regional objectives of the Ontario Ministry of Environment which nevertheless is committed to “developing an approach to considering cumulative impacts of mobile and area sources”.


Key Quotes:

“[the report] examines when, where and how air monitoring is currently being used in Ontario as a tool to assess and address local airsheds and/or micro-environments, and when, where and how it could or should be used as a tool to assess air quality impacts and protect human health.”

“As a rule, the MOE does not get involved in the assessment of local airsheds in a comprehensive way because the MOE does not see itself having regulatory authority or jurisdiction for many of the emission sources within a community”

“the Province may need to recognize that: the MOE air quality expertise is needed to assess and address air quality in a cumulative way; and the MOE needs to move beyond its focus on point source to include mobile and area sources as well as point sources.. emissions associated with vehicles and traffic corridors are considered a very high priority..”

“The AQI air monitoring network is composed of 40 air monitoring stations that are located across the province.. intended to measure ambient air quality and are used to support the issuance of smog advisories when elevated AQI levels are forecast to occur…intentionally sited in areas that will not be heavily influenced by local emission sources such as large industrial facilities or highways”

[Environmental Commissioner of Ontario annual report] “Municipal representatives observed that MOE’s role in air quality protection needs to evolve, to address not only large point sources, but also the cumulative impacts of mobile and area sources, such as traffic corridors and residential home heating. As municipalities become increasingly intensified, we are bound to see growing public pressure to maintain acceptable air quality in highly urbanized settings. In order to effectively manage urban air quality, we will certainly need to assess it.”

[Ministry of Environment of Ontario response] “The ministry operates a state-of-the art ambient air monitoring network and works with stakeholders, including various levels of government and academia, in assessing the impacts of street-level emissions on air quality along major traffic corridors and in high density urban areas.. These street-level monitoring activities, together with air-quality modeling, will enable the ministry to determine whether more comprehensive air monitoring networks would benefit the health of Ontarians. MOE has committed to developing an approach to considering cumulative impacts of mobile and area sources”


Enhanced by Zemanta

Friday, October 8, 2010

Sharing Transportation and Mobility


Eric Britton
Image via Wikipedia


Sharing: Strategy for a Small Planet (World Streets, Sept. 27, 2010)

Also discussed here: World Share/Transport Forum: Kaohsiung 2010 - The Third Way of Getting Around in Cities (Kaohsiung. 16 - 19 September 2010)

The article in focus today is the introductory speech by well known mobility expert and commentator, Eric Britton, to the recent first international Share/Transport Conference in Kaohsiung, China. He points to the growth of mobility in general as well as the damaging impacts of motorized transport and to the mind-boggling estimate of the total world-wide trips made by people each year – five trillion! Most importantly, he highlights the direction that this is taking us toward: sharing,  and away from: individual use of vehicles.


Key Quotes:

“Americans (or French or  or . . . ) love their cars and that they are too individualistic to share”

“twenty percent..relative importance of the transport or mobility sector in this greater whole..the sector’s  share of GHG emissions, fossil fuel consumption.  overall resource take, investment requirements.”

“the amount of activity in our sector is expanding at sharply growing rates.  The number of cars. The number of kilometers driven. Lost time in traffic. Increasing costs. Health impacts”

“the number of major trips that are made by individual citizens each year – think of a work trip, medical visit, trip to find and carry water and firewood, soccer mom’s taking the kids to their next organized sport session, and the like. There are more than five trillion of these taking place each year”

“Share/transport..low-carbon, high-impact, available-now mobility options .. between the long dominant poles of “private transport” (albeit on public roads) and “mass transport” (scheduled, fixed-route, usually deficit-financed public services) at the two extremes.”


Enhanced by Zemanta

Thursday, October 7, 2010

Wood-Burning Health Impacts


Wood-burning fireplace with burning log.
Image via Wikipedia


Critical Review of the Health Effects of Woodsmoke (75 page pdf, University of California at Berkeley, 2005)

Also discussed here:  Wood-burning blamed for poor air in Fairbanks (USA Today, Jan. 14, 2010)

And here: Health Impacts from Particle Pollution (Clean Air Fairbanks, Sept. 21, 2010)


As today’s article under review reports, wood is used as a heating fuel in many parts of the western USA and Canada (and New Zealand) because of its cheap access and need for warmth during the long winters. The health impacts from wood-burning emissions is not as well known and is the focus of the report, noting that between 40 and 90% of winter particulate pollution may be traced back to wood-burning sources.

Key Quotes:

“On winter days when the air is still and Fairbanks area residents fire up their wood stoves and outdoor boilers, Alaska's second-largest city becomes entombed in a shroud of pollution.. due in part to wood stoves and outdoor boilers that belch out small particles, forcing residents to breathe some of the unhealthiest air in the nation”

“In 2006, the Environmental Protection Agency cut the acceptable level of particulates nearly in half, from 65 micrograms per cubic meter to 35 micrograms. From late December to early January, Fairbanks exceeded the limit for particulates on 11 consecutive days.”

“because of wood availabilities, Finland, Sweden, and Canada burn more biomass fuel per capita than other countries.. In Canada, such fuels increased at about 2.4% annually during the 1990s, more than half again as fast as overall energy demand”

“At least 26 hazardous air pollutants are known to be present in woodsmoke.. The main gaseous pollutants in woodsmoke, such as carbon monoxide and nitrogen oxides, add to the atmospheric levels of these regulated gases coming from other combustion sources and thus have always been regulated alike with them”

“Woodsmoke particles are generally smaller than 1 μm, with a peak in the size distribution between 0.15 and 0.4 μm.. Particles in this size range are not easily removed by gravitational settling and therefore can be transported over long distances”

“Residential wood burning is common in the Western US and Canada ..data from San Jose [172], which indicates that 42% of the PM10 during winter months could be attributed to wood burning.. Christchurch, New Zealand is another city impacted by woodsmoke. It is estimated that more than 90% of particulate matter (PM) air pollution is emitted from wood burners and open fires during winter”


Enhanced by Zemanta

Wednesday, October 6, 2010

Masdar City Update


Arabian Desert by NASA World Wind
Image via Wikipedia


In Arabian Desert, a Sustainable City Rises (New York Times, Sept. 25, 2010)


The most read post on this blog has been Masdar City – zero carbon, zero waste which described the Masdar City concept.

Today’s review article reports on progress made since then with new approaches to the design of buildings, rasied to to take advanatage of cooling desert winds and a replace pollution emitting vehicles with a fleet of small electric ones underground.

Key Quotes:

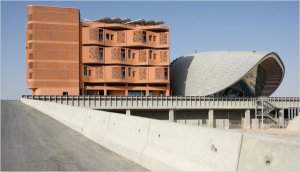
“Masdar, would be a perfect square, nearly a mile on each side, raised on a 23-foot-high base to capture desert breezes. Beneath its labyrinth of pedestrian streets, a fleet of driverless electric cars would navigate silently through dimly lit tunnels”

“Not only did he close Masdar entirely to combustion-engine vehicles, he buried their replacement — his network of electric cars — underneath the city.”

“he located almost all of the heavy-duty service functions — a 54-acre photovoltaic field and incineration and water treatment plants — outside the city.”

“To conform to Middle Eastern standards of privacy, Mr. Foster came up with an undulating facade of concrete latticework based on the mashrabiya screens common in the region. The latticework blocks direct sunlight and screens interiors from view, while the curves make for angled views to the outside, so that apartment dwellers never look directly into the windows of facing buildings.”


Enhanced by Zemanta

Tuesday, October 5, 2010

Global Satellite Mapping of Particulates Over Long Term

Global Estimates of Ambient Fine Particulate Matter Concentrations from Satellite-Based Aerosol Optical Depth: Development and Application (9 page pdf, Environ Health Perspect 118:847–855, 16 March 2010)

Also discussed here: New Map Offers a Global View of Health-Sapping Air Pollution (Science Daily, Sept. 23, 2010)


The first estimates of long term air quality, based on satellite measurements, for many cities in the world is the result of scientists who published the article under review today. Even for those cities such as Ottawa whose air quality has been monitored by satellite for short term pilot projects, as described in this paper in 2009 Mapping Small Scale Air Pollution Distribution Using Satellite Observations in a Large Canadian City. These data are useful in comparing comparative population exposures– which shows that over 80% of the world’s population breathes air that exceeds the WHO criteria of 10 ugm/km3 (annual average).

Key Quotes:

“In addition to using satellite data from NASA's Multi-angle Imaging SpectroRadiometer (MISR) ..and the Moderate Resolution Imaging Spectroradiometer (MODIS) instrument .. the researchers used output from a chemical transport model called GEOS-Chem to create the new map”

“Their map, which shows the average PM2.5 results between 2001 and 2006.. the first PM2.5 satellite estimates in a number of developing countries that have had no estimates of air pollution levels until now”

“more than 80 percent of the world's population breathe polluted air that exceeds the World Health Organization's recommended level of 10 micrograms per cubic meter. Levels of PM2.5 are comparatively low in the United States, though noticeable pockets are clearly visible over urban areas in the Midwest and East”

“Human-generated particles often predominate in urban air -- what most people actually breathe -- and these particles trouble medical experts the most.. smaller PM2.5 particles evade the body defenses -- small hair-like structures in the respiratory tract called cilia and hairs in our noses -- that do a reasonably good job of clearing or filtering out the larger particles”

“in the United States alone, PM2.5 air pollution spark some 60,000 deaths a year”

"We still have some work to do in order to realize the full potential of satellite measurements of air pollution.. But this is an important step forward"


Enhanced by Zemanta