Thursday, June 12, 2014

Is Windshield Washer Spray a Health Hazard?

Windshield Washer Fluid a Source of Legionnaires (ASMevents, American Society for Microbiology, May 19, 2014)

Also discussed here: Windshield washer fluid a source of Legionnaires: Found in most school buses (ScienceDaily, May 18, 2014)

Today we review research by Otto Schwake who established a link between windshield washer fluid and Legionnaires’ disease, a severe form of pneumonia. The link is a bacteria, Legionella, found in the fluid which is transmitted to humans in the mist that is formed when sprayed on the windshield and then inhaled. The bacteria can also cause Pontiac fever, a milder illness resembling the flu. More bacteria were found in summer than in winter and in 75% of the washer fluid samples taken from school buses in Arizona. Although most people exposed to this threat do not become sick, seniors and smokers are at most risk. As much as 20% of those affected by Legionnaires’ disease in the UK, outside of those in hospitals, was found to be associated with automobile windshield washer fluid. One more reason to reduce the number of cars on the  road and the pollution they cause.

   windshieldwasherfluid_small 

Key Quotes:

"Washer fluid spray can release potentially dangerous numbers of these bacteria into the air. These results suggest that automobiles may serve as a source of transmission for Legionella infections,"

“Legionella are bacteria that are found naturally in the environment, usually in water. They are commonly associated with the cooling towers found in large-scale air conditioners and hot tubs. They are not spread from person to person but instead are transmitted via mist or vapor containing the bacteria”

“the bacterial concentrations increased over time and they were able to maintain stable populations for up to 14 months. In the second study, they tested the washer fluid from school buses in central Arizona and found culturable Legionella in approximately 75% of the samples”

"One such study attributed nearly 20 percent of Legionnaires' disease cases in the United Kingdom not associated with hospitals or outbreaks to automobile windshield washer fluid.”

“Most of the people exposed don’t become sick…Those most at risk include the elderly, smokers and those with weakened immune systems”

“Washer fluid has the traits a potentially dangerous source of Legionella exposure needs…It is aerosolized, heated and people are regularly exposed to it. The results from this study support previously demonstrated epidemiological evidence for a link between automobiles and Legionnaires’ disease by providing microbiological data on survival, presence and transmission of Legionella in washer fluid.”

"While potential transmission of a deadly respiratory disease from a source as common as automobile windshield washing systems is significant, the study also points to the fact people can be exposed to pathogens -- particularly those occurring naturally in the environment -- in previously unknown and unusual ways."

Tuesday, June 10, 2014

How does Roadside Noise Impact Health?

Road traffic noise frequency and prevalent hypertension in Taichung, Taiwan: A cross-sectional study (22 page pdf, Ta-Yuan Chang, Rob Beelen, Su-Fei Li, Tzu-I Chen, Yen-Ju Lin, Bo-Ying Bao, Chiu-Shong Liu, Environmental Health, Mat 16, 2014)

Also discussed here: What Can Be Done to Reduce Health Impacts from Roadside Vehicle Emissions?

And here: How Does Outside Air Pollution Affect Indoor Air Pollution?

Today we review research into the link between roadside noise and heart disease, noting that earlier studies had shown a link between heart disease and traffic-related air pollution. Results indicate that exposure to noise at different frequencies is strongly linked to hypertension, especially exposure to noise from motorcycles. These results provide further justification for municipal zoning which keeps heavy traffic at a safe distance from residences, especially for old age nursing homes where heart disease is frequently the cause for death. Steps have been taken in Halton Region in southwestern Ontario, Canada to do precisely that where major roads would be less than 30 m away from housing developments (or highways within 150 m).

 roadside noise  

Key Quotes:

“Noise exposure may induce the development of hypertension, which is an important risk factor for cardiovascular disease, and many epidemiological studies have shown the association between hypertension and road traffic noise exposure”

“Our study is the first to show the association between the prevalence of hypertension and frequency components of road traffic noise. We found that residents exposed to high levels of road traffic noise at 63, 125 and 1000 Hz had a significantly higher risk of hypertension.”

“all types of traffic were significantly correlated with low-frequency noise exposure. Motorcycles, the dominant source of traffic noise in central Taiwan [11], had the highest correlation coefficients at 63 and 125 Hz.”

 “We also found a high correlation ..between noise exposure and total traffic flow rate that was consistent with the results of previous studies. One previous study measured traffic noise and NO2 in Canada (r = 0.53) …and another study measured NO2 and modeled traffic noise in Spain (r = 0.62) ….total traffic flow rate was used as a surrogate of traffic-related air pollution in the multiple logistic regression models“

“Another solution, being pursued in Canada, is to require developers to build homes for the vulnerable populations of children and the elderly at least 30 m away from major roads or 150 m from highways (or provide air quality evidence that it is safe)- as municipal authorities in Halton Region have done recently.”  
Enhanced by Zemanta

Friday, June 6, 2014

Why Isn’t Canada Meeting Its Greenhouse Gas Emission Targets?

Allocating Canadian Greenhouse Gas Emission Reductions Amongst Sources and Provinces: Learning from the European Union, Australia and Germany (185 page pdf, Douglas Macdonald, Jochen Monstadt, Kristine Kern, University of Toronto, Apr 2013)

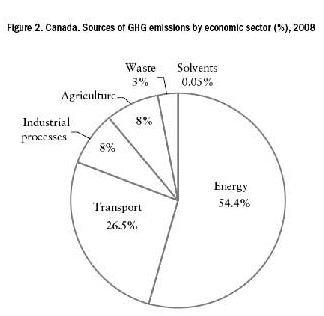
ghg sources canada 2008Also discussed here: Kyoto Protocol (Wikipedia)

And here: State-and-Trends of the Environment: 1987–2007 Chapter 2 Atmosphere (44 page pdf, United National Environment Program, 2008)

And here: History of the Global Climate Change Regime (18 page pdf, Daniel Bodansky, 2012)

And here: 2014 Air Quality and Climate Change Management Plan (165 page pdf, City of Ottawa Environment Committee, May 20, 2014)

The quick answer to the question posed is: lack of engagement and consensus for action by the provinces who have prime responsibility for energy, environment and natural resources. Today, we review an academic report and analysis of the reasons for Canada’s failure to meet international agreements to reduce greenhouse gas emissions since the first commitments were made by the Prime Minister at the United Nations-sponsored “Changing the Atmosphere Conference” in Toronto in 1988 - where it was agreed that Global CO2 emissions be cut by 20% by 2005 but without national obligations which came later with the 1997 Kyoto Protocol. He made this commitment without having prior provincial support to do so – an issue not a faced by most other heads of government, even from nations with states or provinces, such as Australia or Germany (whose efforts to reduce GHG emissions are also analysed in this report).

The lack of national leadership (and mandate), the lack of provincial consensus and the difficulty in getting provincial agreement, even with a national coordination secretariat (which existed from 1998-2003), is blamed on the uneven costs for implementing such a plan, with most of the costs and emissions coming from Alberta and Ontario whose energy and transportation sectors make up over 80% of the emissions for Canada. On top of this, the resistance of Canada’s largest trading partner, the USA, to agree to reductions has hampered Canadian efforts, let alone ratify the agreement under the Kyoto Protocol to reduce emissions by 6% (base year 1990) by 2012. The current administration in 2011 decided to withdraw from the Kyoto Protocol and adopt a goal of a 17% reduction in total emissions (from a 2005 base year) by 2020, consistent with American plans, but again without consensus on provincial responsibilities. ghg allocations canada    

Key Quotes:

“By 2020, existing federal and provincial programs will only achieve half of Canada’s goal of reducing greenhouse gas (GHG) emissions to 17% below the 2005 level.”

“if all provinces fully meet their targets… and without including reductions resulting from federal government policy, total Canadian emissions in 2020 would be 598.7 Mt. That would be a reduction of 246.5 Mt from projected Business as Usual level of emissions in 2020"

“The Canadian Constitution gives ownership of natural resources to the provinces, which means they have guaranteed jurisdiction in the policy fields of environment and energy; and the larger provinces such as British Columbia, Alberta, Ontario, and Quebec have consistently resisted federal government intrusion into what they see as their environmental policy jurisdiction”

“Canada is in the process of implementing not just one climate-change plan; instead, it has eleven plans,.. being implemented separately and almost completely without coordination by eleven governments—the federal government and ten provincial governments. … a “fragmented ‘go-it-alone’ approach.”

“The main thing which must be co-ordinated is the allocation of the total GHG reduction amongst the various sources, such as transportation, resource extraction, building insulation, and manufacturing. Since their reduction costs vary, economic efficiency means we cannot ask each source to reduce by the same percentage amount.”

“Both Australia and Germany are relatively centralized federated states, meaning that, unlike Canada, in those countries national climate-change policy can be made by the national government alone, without explicit agreement among subnational governments on cost allocation.”

“In Canada, Alberta and Saskatchewan, presumably due to the fact they have faced higher per-capita reduction costs than other provinces have, not surprisingly, been the provinces most resistant to national policy”

"Due to immigration, the Canadian population increased steadily from 1990 to 2011, with a 24.63% net increase over that time” [an increase of about 1% per year]    
Enhanced by Zemanta

Wednesday, June 4, 2014

How Polluted are the World’s Cities?

Ambient (outdoor) air pollution database, by country and city (Excel data base, World Health Organization, May 7, 2014)

Also discussed here: Ambient (outdoor) air pollution in cities database 2014 (World Health Organization, May 7, 2014)

And here: Air quality deteriorating in many of the world’s cities (Press Release, World Health Organization, May 7, 2014)

And here: Ambient (outdoor) air quality and health (World Health Organization, Fact sheet N°313, Updated March 2014)

And here: Top 20 most polluted cities in the world (Madison Park, CNN, May 8, 2014)

Today we review a report from the World Health Organization that presents the state of air quality in 1600 cities world-wide in an Excel data base that is easy to manipulate. Only 1/8th of the cities surveyed meet WHO guidelines for fine particulate matter (PM). Those that do better (examples Bogota, Colombia and Copenhagen, Denmark) do it by actively promoting cycling and walking. 88% of the 3.7 million premature deaths/ year because of air pollution occur in low and middle income countries and most of these are in the Western Pacific and Southeast Asia. 7 out of the 10 most polluted cities with the highest levels of particulate matter (PM10) are in Pakistan (Pakistan: Peshwar, Rawalindi and Karachi) or India (Gwalior, Ahvaz, Raipur and Delhi) while all 10 of the least polluted cities are in the USA (mainly in the southwest). Even in regions such as Europe, where WHO guidelines are generally met, lives are shortened by 8.6 months because of exposure to PM

. pm in world cities

PM10: Fine particulate matter of 10 microns or less; Amr: America, Afr: Africa; Emr: Eastern Mediterranean, Sear: South-East Asia, Wpr: Western Pacific; LMI: Low- and middle-income; HI: high-income. PM10 values are regional urban population-weighted.  

Key Quotes:

 “The database contains results of ambient (outdoor) air pollution monitoring from almost 1600 cities in 91 countries. Air quality is represented by annual mean concentration of fine particulate matter …The database covers the period from 2008 to 2013, with the majority of values for the years 2011 and 2012.”

“Only 12% of the people living in cities reporting on air quality reside in cities where this complies with WHO air quality guideline levels. About half of the urban population being monitored is exposed to air pollution that is at least 2.5 times higher than the levels WHO recommends - putting those people at additional risk of serious, long-term health problems.” “Guideline values: PM2.5 10 ÎĽg/m3 annual mean, PM10 20 ÎĽg/m3 annual mean”

“Too many urban centres today are so enveloped in dirty air that their skylines are invisible…Not surprisingly, this air is dangerous to breathe. So a growing number of cities and communities worldwide are striving to better meet the needs of their residents - in particular children and the elderly."

“even in the European Union, where PM concentrations in many cities do comply with Guideline levels, it is estimated that average life expectancy is 8.6 months lower than it would otherwise be, due to PM exposures from human sources.”

 “No Chinese cities ranked in the top 20 most polluted cities, despite thick, gray smog filling its cities and millions of residents commuting behind surgical masks.”

“Effective policies and strategies are well understood, but they need to be implemented at sufficient scale. Cities such as Copenhagen and BogotĂ , for example, have improved air quality by promoting ‘active transport’ and prioritizing dedicated networks of urban public transport, walking and cycling.”

“Half of the top 20 cities in the world with the highest levels of PM2.5 were in India…Other cities with high levels were located in Pakistan and Bangladesh.”

 “Ambient (outdoor air pollution) in both cities and rural areas was estimated to cause 3.7 million premature deaths worldwide in 2012….The Guidelines indicate that by reducing particulate matter (PM10) pollution from 70 to 20 micrograms per cubic metre (ÎĽg/m), we can cut air pollution-related deaths by around 15%.”
Enhanced by Zemanta

Monday, June 2, 2014

How does the Public View the Cost of Air Pollution and Noise?

Multi-country willingness to pay study on road-traffic environmental health effects: are people willing and able to provide a number? (24 page pdf, Tifanny Istamto, Danny Houthuijs and Erik Lebret, Environmental Health,May 9.2014)

Today we review research aimed at finding ouit how to ask the publics in four European countries what cost the see in the impacts of air pollution and noise, recognizing that these two environmental conditions impact the public in different ways and so must be assessed differently. One of the challenges in designing questionnaires is to identify and if possible reduce the number of don’t know (DK) and protest vote (PV) answers through the use of factual choices and scenarios in a process meant to capture what the public is willing to pay (WTP) to reduce the impacts- and then assess if the proportion of DK’s varies by country or socio-economic status etc. About 1/3 of the PVs thought that the polluter or the government should pay for
  reducing air pollution or noise. questions about pollution and noise  

Key Quotes:

“Willingness-to-pay (WTP) is a central concept in the assessment of the external costs of environmental pollution. It attempts to translate people’s preferences for environmental goods, e.g. clean air and a quiet living environment and willingness to avoid environmental health effects. It describes the monetary equivalent of the loss of welfare related to intrinsic values.“

“The WTP can be assessed by directly asking the individuals what the good or the effect is worth to them using the survey-based method of contingent valuation (CV) approach…the CV approach directly or indirectly questions respondents about their WTP through open-ended questionnaires, bidding games, payment card methods or alternatives thereof. The WTP values thus may cover private costs as well as public good costs, depending on context and value system of respondents.”

“the questionnaire consisted of the three main groups of questions:
  1. social-economic factors, recognised in the economics literature and others, i.e. household income, gender, education/socio-economic status,
  2. factors known from the public health field, i.e. severity of health effects, familiarity with the effects, current health status, and
  3. factors from the social sciences domain, i.e. familiarity and perception of risks, level of awareness, level of concern of environmental health effects, perceived level of exposure.”
“For air pollution, it explained that a 50% decrease in the air pollution emissions by 2030 was related to half a year gain in average life expectancy. For noise, an increase from 50 dB to 65 dB meant an increase of 13% to become severely annoyed by noise.”

“What is the maximum amount of money you personally are willing to pay annually for the rest of your life to avoid 100 additional cases per 10,000 children of poorer reading performance due to traffic noise?”.

“About a third of PV were because respondents thought that costs should be included in transportation prices, i.e. the polluter should pay, with approximately another third because respondent thought that the government should pay costs to reduce levels.”

“The likelihood of protest vote and “don’t know” response was influenced by social demographic, economic and health factors, people’s awareness of effects, environmental concerns, and appreciation of environmental conditions and policies.”  
Enhanced by Zemanta

Wednesday, May 28, 2014

What is the Impact of Air Pollution on IQ and Lifetime Earnings?

Prenatal exposure to airborne polycyclic aromatic hydrocarbons and IQ: Estimated benefit of pollution reduction (Abstract, Frederica Perera, Katherine Weiland, Matthew Neidell and Shuang Wang, Journal of Public Health Policy, May8, 2014)

Also discussed here: Improving air quality in NYC would boost children's future earnings by increasing IQ (ScienceDaily, May 8 2014)

Today we review research into the link between a pollutant associated with the burning of fossil fuels in an urban environment (polycyclic aromatic hydrocarbons or PAH) and the impact on a child’s IQ, and further, how a lower or higher IQ affects lifetime earnings by that child. The impact of air pollution on aging and seniors has been studied as has the impact on pregnant women and the health of their babies but this is the first we have seen to make the link to IQ and lifetime earnings. Results indicate that a 25% decrease in PAH translates to an increase of $215 earnings for the population of New York City.
 

NYC pollution  

Key Quotes:

“The developing fetus and young child are especially vulnerable to neurotoxicants, such as polycyclic aromatic hydrocarbons (PAH) released to ambient air by combustion of fossil fuel and other organic material”

"Our analysis suggests that a modest reduction in urban air pollution would provide substantial economic benefits and help children realize their full potential…The researchers made their calculation using a hypothesized modest reduction of .25 nanograms per cubic meter air (ng/m3) of ambient concentrations of polycyclic aromatic hydrocarbon (PAH), a family of chemicals created by burning fossil fuels that is ubiquitous in urban air"

“Gains in IQ related to the hypothetical 25% reduction in PAH translated to increased lifetime earnings of $215 million.”
Enhanced by Zemanta

Monday, May 26, 2014

Monitoring Personal Pollution Exposure and Location with a GPS

Using Global Positioning Systems (GPS) and temperature data to generate time-activity classifications for estimating personal exposure in air monitoring studies: an automated method(21 page pdf, Elizabeth Nethery Gary Mallach, Daniel Rainham. Mark S Goldberg, Amanda J Wheeler, Environmental Health, May 8, 2014)

 exposure by gps

Today we review research that looks at the advantages offered by a GPS and a PM2.5 particulate sensor to monitor 70 children and the pollution sources and durations they are exposed to over 10 days. The pollution sources vary between indoors and outdoors, using transit or driving, as well as in proximity to roadside emissions in the large metropolitan area that Montreal is. This approach improves upon the data that can be collected from a personal pollution exposure sensor that only produces the total pollution exposure over a given time period by breaking down the exposure by location. The use of a GPS also precludes the need to keep a diary as well as offering more convenience and accuracy, and possibly an effective way of monitoring larger populations for longer periods- if smart phones with a sensor were used for example..  

Key Quotes:

 “A pollutant mixture that varies within small spatial distances is urban air pollution. For example, specific traffic-related air pollutants are often higher on busy city streets in comparison to suburban ones [1]. Understanding personal exposure to air pollution is complicated by an individuals’ activities and where they are physically located, and the resultant interactions with different levels of air pollution”

 “we describe an automated classification of GPS data into location-based categories that makes use of temperature data to assist in discriminating indoor from outdoor locations.”

 “Mean times spent in different locations as categorized by a GPS-based method were comparable to those from a time-activity diary, but there were differences in estimates of exposure to PM2.5 from the two methods. An automated GPS-based time-activity method will reduce participant burden, potentially providing more accurate and unbiased assessments of location.”
Enhanced by Zemanta