Thursday, December 1, 2016

How do Travel Demand and Economics Affect the Development of Urban Road Networks?

A Model of the Rise and Fall of Roads (33 page pdf, Zhang, Lei, Levinson, David M, Systems Symposium at the Massachusetts Institute of Technology, Mar. 2004)

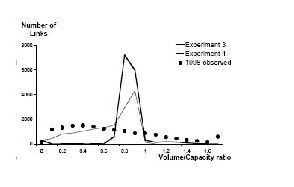
Today we review a seminal paper from over a decade ago that examines the dynamics of road development in a major mid-West American city (Minneapolis-Saint Paul) using a model that combines measures such as travel demand statistics (usually found on Origin Destination studies) with the economics of road pricing or tolls, geographical constraints (such as rivers and mountains) and how these change with newer technology over time (in this case over 20 years). Roads represent both figuratively and physically the link that join the issues addressed in this blog: how traffic is linked to pollution and how pollution is linked to health. Of particular interest is the way that travel demand and road volume capacity (VC) interact with road tolls and the cost of road construction and the resulting revenue that may be used to ease congestion, in addition to the overall design of the road network and design for a major urban area. road-links  
Key Quotes:

 “In 1900 there were 240 km of paved road in the United States … and this total had increased to 6,400,000 by 2000 …with virtually 100% of the U.S. population having almost immediate access to paved roadways.”

“questions yet to be answered: (1) How do the existing links (roads) develop and degenerate? (2) How are new links added to the existing network? (3) How are new nodes added to the existing network?” “the Twin Cities transportation network which comprises nearly 8,000 nodes and more than 20,000 links, using network data collected since year 1978”

Specific questions on the rise and falls of roads:
  1. “Why do links expand and contract?
  2. Do networks self-organize into hierarchies?
  3. Are roads (routes) an emergent property of networks?
  4. What are the parameters to be calibrated in a microscopic network dynamics model?
  5. Is the model computationally feasible on a realistic transportation network?
  6. Is the model capable of replicating real-world network dynamics?”
“economic growth is a two-way interaction between the economy and technology; technological research transforms the economy that finances it.. transportation investment drives the growth that funds it.” “In developed countries where transportation infrastructure has reached its saturated stage, it is rare to see new network growth from a tabula rasa. Even in an empty place without any previous developments, natural barriers such as rivers and mountains still impose constraints on future network growth.”

“Longer, faster, and high-demand (traffic flow) links should be able to generate more revenues. If not maintained appropriately, link LOS [Level of Service] will decrease over time due to physical deterioration caused by the environment and traffic.”

“link expansion cost is positively correlated to lane-miles of expansion and road hierarchy (interstate, state highway, county highway, etc.), while negatively related to the distance from the nearest downtown” “most roads carry flows well below their capacity and a few roads operate at VC [volume capacity] ratios near or slightly higher than one. Practically, over a long period of time, no road can carry flows more than its capacity.”

 “some important system properties, such as road hierarchies and self-organization in transportation networks, can be predicted through a microscopic evolutionary process, a demonstration that such a microscopic agent-based model of network dynamics can be feasibly applied to large-scale realistic transportation networks, and an enquiry into how this concept can be realized and produce useful modeling tools for planners.”

Tuesday, November 29, 2016

The Tire and Brake Share of Traffic-Related Air Pollution

Studded tyre Español: Neumático de invierno co...
Studded tyre Español: Neumático de invierno con clavos, modelo Nokian Hakkapeliitta 4 (Photo credit: Wikipedia)


Key Quotes: 

“Tyre rubbish is the 13th largest source of air pollution in Los Angeles, California, a city famous for its smog. A recent study showed links between PM2.5 particles and the daily death rate in 6 Californian counties. When the PM2.5 count was high, so was the death rate” 

 “research now contends possible links to lung cancer from recycling some of the 1 billion dead tyres used in, for example, the surfaces of playgrounds. Some are calling it the new asbestos” 

“there are over 1 billion cars on the road globally and on top of that just as many motorbikes and scooters. Add to that the pneumatic tyres used on trucks and public transport such as metro train systems and buses and we have a considerable source of road rubber. A road with 25,000 vehicles using it each day can produce up to nine kilograms of tyre dust per kilometre.”

 “Oslo announced a plan to ban all cars from its city centre in 2019; and Norway is in the process of preparing a bill that would issue a nation-wide ban of the sale of petrol-powered cars. In places such as Tuscany, cars are banned in city centres except for residents.”

Thursday, November 24, 2016

How Can Cities Reduce Methane Emissions?

Mitigation of methane emissions in cities: how new measurements and partnerships can contribute to emissions reduction strategies (39 page pdf, Francesca M. Hopkins, James R. Ehleringer, Susan E. Bush, Riley M. Duren, Charles E.Miller, Chun-Ta Lai, Ying-Kuang Hsu, Valerie Carranza, James T. Randerson, Earth’s Future, Sep. 10, 2016)

Today we review research into methane emissions from cities which along with other greenhouse gases contributes to climate warming. Cities themselves account for 70% of GHG emissions globally. Unlike CO2 however, methane emissions are more easily managed at the city level whether they come from transportation and the increased shift to natural gas as a fuel for city vehicles or, secondarily, from landfills where methane is emitted from decomposing organic materials or, thirdly, from leaks in the systems delivering natural gas to users. One of the major problems is the lack of accurate inventories of methane emissions which in some cities results in an underestimate of 50%. Some efforts being made in the transportation sector to reduce CO2 emissions include shifts to the use of propane or natural gas but these may have unintended consequences in terms of their contribution as a radiatively active gas to the greenhouse effect. Landfill emissions may be reduced by simply reducing the amount of waste generated though pricing of garbage or encouraging home composting.

 methane-emissions  

Key Quotes:

“Methane differs from CO2 in that mitigation is technologically and economically feasible… Unlike CO2, a large fraction of methane is lost as fugitive emissions from engineered systems, such as leaks from natural gas pipelines.”

 “some strategies to reduce CO2 emissions, such as substituting natural gas for other fossil fuels such as coal and diesel, may have the unintended consequence of increasing radiative forcing by increasing fugitive methane emissions.. methane emission rates are currently underestimated in greenhouse gas inventories … and thus it is unclear if switching to methane-based fuels provides a net benefit for climate mitigation.”

“the most important sectors for urban methane emissions are energy, waste, agriculture, and transportation, respectively …Energy and transportation primarily emit fossil methane derived from natural gas, whereas waste treatment and agriculture produce biogenic methane from the process of anaerobic decomposition”

“Natural gas vehicle use has grown rapidly over the past decade, and will continue to grow globally, particularly in developing countries in South Asia and Latin America …In the United States, use of natural gas as a transportation fuel is growing most rapidly for heavy duty and mass transit vehicles”

“Methane production can be prevented by reducing the amount of waste that ends up in landfills— cities have implemented this approach with pay-as-you-throw pricing and diversion of organic waste to alternative treatment such as composting”

 “Methane from wastewater is the fastest growing emission source outside of fossil fuels, expected to increase by 19% over the next two decades as population grows, particularly in developing economies”

“recent studies have used CO and CO2 inventories to quantify methane emissions in Los Angeles, revealing emissions up to 50% larger than inventory estimates”

Tuesday, November 22, 2016

The Future of the World and Cities in It

Indoor and Built Environment
Indoor and Built Environment (Photo credit: Wikipedia)
Urban futures: anticipating a world of cities (6 page pdf, Geci Karuri-Sebina, Karel-Herman Haegeman and Apiwat Ratanawaraha, Foresight, Sep. 10, 2016)


Key Quotes: 

“Modern urbanisation has led to a larger number of megacities (over 10 million inhabitants) and rapidly growing smaller towns and cities. In 1950, only two megacities existed in the world; New York-Newark (USA) and Tokyo (Japan). By 2015, it is reported that 35 megacities were in existence, the largest of these being Tokyo and Shanghai (China), each with populations of over 30 million inhabitants” 

“rapid urbanisation is hailed as being a transformative force, improving economic prospects and quality of life for the majority, alleviating poverty, driving innovation and productivity, working towards social inclusion and contributing to national and regional development“

 “On the other hand, there are also real tensions and contradictions that emerge. For example, similar to economic activity and growth, unemployment/joblessness and poverty are largely urban….they also remain the loci of major political conflicts, driven by racial and cultural tensions and diverging citizen values, which are increasingly propelled by the proliferation of digital media”

 “The trend of urbanisation is also accompanied by efforts in various parts of the world to decentralize political and administrative functions to local governments so as to enhance good governance.” 

“Urban challenges are tremendous, and the types of challenges addressed in anticipatory initiatives are seemingly suitably vast, ranging from sustainability, the built environment, energy, culture and mobility to security and food security, exposure to flood and drought hazards, values, multicultural aspects” 

“The 21st century will not be dominated by America or China, Brazil or India, but by The City. In a world that increasingly appears ungovernable, cities – not states – are the islands of governance on which the future world order will be built”  

Thursday, November 17, 2016

How is Air Pollution Linked to Type 2 Diabetes?

Association Between Long-Term Exposure to Air Pollution and Biomarkers Related to Insulin Resistance, Subclinical Inflammation and Adipokines (Abstract, Kathrin Wolf, Anita Popp, Alexandra Schneider, Susanne Breitner, Regina Hampel, Wolfgang Rathmann, Christian Herder, Michael Roden, Wolfgang Koenig, Christa Meisinger, Annette Peters, KORA-Study Group, Diabetes, Aug. 8, 2016)

Also discussed here: Air pollution a risk factor for diabetes, say researchers (ScienceDaily, Sep.8, 2016) And here: Diabetes Research - Risk Factor Air Pollution (Press Release, Helmholtz Zentrum München, Sep. 8, 2016)

And here: Air pollution exposure found to be risk factor for type 2 diabetes (Green Car Congress, Sep. 8, 2016)

Today we review research from Germany which examined the level of air pollution at the places of residence of 3,000 participants and how this relates to blood marker levels such as impaled glucose metabolism and the risk of Type 2 diabetes. Results indicate that a 7.9μg/m3 increment in particulate matter <10μm was associated with insulin resistance and that NO2, in particular, had a highly significant effects with pre-diabetic individuals as opposed to those who were either diabetic or not.

 type-2-diabetes-and-pm  

Key Quotes:

“the German Heart Centre analyzed the data of nearly 3,000 participants of the KORA study who live in the city of Augsburg and two adjacent rural counties”

“Exposure to air pollution at the place of residence increases the risk of developing insulin resistance as a pre-diabetic state of type 2 diabetes.”

 "The results revealed that people who already have an impaired glucose metabolism, so-called pre-diabetic individuals, are particularly vulnerable to the effects of air pollution…In these individuals, the association between increases in their blood marker levels and increases in air pollutant concentrations is particularly significant! Thus, over the long term -- especially for people with impaired glucose metabolism -- air pollution is a risk factor for type 2 diabetes."

“Among all participants, a 7.9μg/m3 increment in particulate matter <10μm was associated with higher HOMA-IR and insulin” “Nitrogen dioxide was associated with HOMA-IR, glucose, insulin, and leptin. Effect estimates for pre-diabetic individuals were much larger and highly statistically significant, while non-diabetic and diabetic individuals showed rather weak associations”

"Lowering the threshold for acceptable air pollution levels would be a prudent step…We are all exposed to air pollution. An individual reduction by moving away from highly polluted areas is rarely an option."

Tuesday, November 15, 2016

Must Cities Shrink to be Sustainable, even with Increased Urbanization?

Sustainability for Shrinking Cities (9 page pdf, Dustin L. Herrmann, William D. Shuster, Audrey L. Mayer and Ahjond S. Garmestani, Sustainability, Editorial, Sep. 7, 2016)  

Today we review an overview (and editorial) focused on sustainability for cities in the face of increasing urbanization worldwide and to the recent trend toward shrinking cities because of economic depression and the hollowing out of city centres as a result. Many large growing, economically-healthy cities tend to replace urban greenspace and urban parkland with high income residential or commercial developments with significant negative impacts on a healthy environment. Shrinking economically poor cities on the other hand are faced with vacant downtown lots some of which steer toward sustainable cities through improved water filtration, dampening of urban flash floods and carbon sequestration. For many coastal cities, sea level rise and threats to human health from more frequent hot spells as a result of climate warming are other issues on cities to adapt sustainably with more thoughtful urban planning.

shrinking-city  

Key Quotes:  

“Observations of past urban dynamics indicate that cities commonly undergo contraction phases …though there remains a need to identify what a sustainable trajectory is for shrinking cities.”

 “a shrinking city can be considered one with a smaller population or economy compared with its past; although, even a threshold of time may invoke an arbitrary designation. Any definition of a shrinking city is confounded with the fact that cities are composed of parcels, streets and neighborhoods that can have different growth and shrinkage trajectories than that of the city in the aggregate”

 “A general goal for the shrinking city was suggested…. as “aligning a city’s built environment with the needs of existing and future populations by adjusting the amount of land available for development”. “In the U.S., the second half of the 20th century was marked by the urban decline era…which saw population loss from the city core via rapid suburbanization, which was facilitated by federal government backing of highway construction.”

 “The shift in urbanization in favor of dense, and arguably traditional, urban neighborhoods can create the circumstances for stabilization in shrinking cities.”

“One significant difference between growing and shrinking cities is the proportion of green space providing ecosystem services which can help accomplish sustainable city goals .. Growing cities experience a net loss of green space, as there is high competition for space with other urban uses. Shrinking cities conversely are faced with an increasing extent of green space, typically in the form of vacant land.”

 “the emerging green space could provide ecosystem services such as water filtration and carbon sequestration, and given appropriate governance are a resource shrinking cities can use to transition to sustainable trajectories”

“For shrinking cities (e.g., Cleveland) that wish to slow decline and stabilize for sustainability, catalyzing change in infrastructure from gray to green infrastructure is a path to facilitate transformation"

 “the issue of legacy soil lead burden in vacant lands … offers a new framing of the problem by promoting human (learning and knowledge), social (urban gardening), and technical (soil testing as a data feedback) capitals to mitigate against soil lead availability, and leverage available natural resources toward urban agroecosystems that benefit local communities.”

 “sea level rise has many of the same outcomes shrinking cities experience through population loss, such as compromised infrastructure and new public health risks experienced by vulnerable populations.”

 “mid-size cities, shrinking or growing, are unique compared to large cities because they are more reliant on local ecosystem services. As such, a strategy for countering shrinking in mid-size cities may be acknowledging and leveraging this reliance for greater flexibility.”

Thursday, November 10, 2016

Can the Paris Agreement on Climate Change Work?

Carbon emissions from various global regions d...
Carbon emissions from various global regions during the period 1800–2000 AD (Photo credit: Wikipedia)
The Paris Agreement and the New Logic of International Climate Politics (28 page pdf, Robert Falkner, International Affairs, Aug.31, 2016) 

Today we review an analysis of the international negotiations from the top-down 1996 Kyoto Accord that today applies only to 15% of global carbon emissions, to the 2009 Copenhagen Accord that failed to reach consensus on a global emission reduction goal but managed to provide an umbrella for all participating countries for future negotiations. To the bottom-up Paris Agreement in 2015, signed by 195 nations, combines domestic politics with international commitments through a “naming and shaming” approach, voluntary national commitments, rachet-up reviews every five years and, perhaps most importantly, definition of a long term goal to reach “net-zero” emissions or “emission neutrality” between 2050 and 2100. As these voluntary commitments would result in a global warming of 2.7 C above pre-industrial levels, further reductions beyond the pledges are needed. The author cautions that “the Paris Agreement cannot be expected to ‘fix’ the climate problem; it can only provide a supportive framework within which states and other actors can achieve the required emissions cuts.”

Key Quotes: 

 “that global GHG emission levels, which were at 52.7 gigatonnes (GT) of carbon dioxide equivalent in 2014, should be brought down to 48 GT by 2025, and 42 GT in 2030. Carbon dioxide emissions alone will need to be reduced to net zero — by 2060–2075 (from 35.5 GT in 2014)” 

“Low-lying island states face an existential threat from rising sea levels while others, especially countries near the Arctic Circle, may experience greater agricultural output and easier access to natural resources as a result of the thawing of permafrost.” 

 “the number of climate change laws and policies worldwide doubled every five years since 1997, with 426 climate change laws and policies in place by the time of the 2009 Copenhagen conference, rising to 804 by the end of 2014.Interestingly, this applies not just to Annex I countries, which have traditionally led the way in climate legislation, but also to non-Annex I countries” 

“the careful wording of key provisions ensures that only some create legal obligations (‘shall’) while others merely express recommendations (‘should’) or create expressions of intent or opinion (‘will’, ‘recognize’).Thus, once the agreement has entered into force, parties will be legally obliged to submit NDCs and report on them every five years, but failure to comply with their own national climate plans will not constitute a breach of international law” 

“Naming and shaming mechanisms operate within diverse global governance contexts, from the International Labour Organization to human rights bodies and corporate social responsibility institutions.They are usually seen as a fallback mechanism where formal compliance and enforcement mechanisms are unavailable or fail to work. “ 

“it is clear that the within the new logic of nationally determined climate action, the Paris Agreement cannot be expected to ‘fix’ the climate problem; it can only provide a supportive framework within which states and other actors can achieve the required emissions cuts. “