Showing posts with label emissions. Show all posts

Thursday, February 23, 2017

Estimating Greenhouse Gas Emissions for 100 Cities in the USA

Per capita anthropogenic greenhouse gas emissi...
Per capita anthropogenic greenhouse gas emissions by country for the year 2000 including land-use change. (Photo credit: Wikipedia)
An integrated approach for estimating greenhouse gas emissions from 100 U.S. metropolitan areas (12 page pdf, Samuel A Markolf, H Scott Matthews, Inês L Azevedo and Chris Hendrickson, Environmental Research Letters, Jan. 25, 2017)

Today we review an approach to estimate the emissions for a large number of cities in the USA which has advantages over the traditional bottom-up approach as well as likely being more accurate because it includes production as well as consumption of carbon emissions and fuels. Emissions from individual cities ranged from 5 metric tons per person in Tucson to 65 meteric tons per person in New Orleans. In gross terms, the average emission for the 100 cities examined was 27 million metric tons per year.

Key Quotes:

“over 80% of the United States’ population lives in metropolitan areas and roughly 75% of the earth’s natural resources are consumed in urban areas”

“bottom-up emission estimates for five sectors within a given city:
  1. use of electricity by the community,
  2. fuel use in residential, commercial, and industrial buildings (e.g.natural gas or fuel oil),
  3. fuel use for on-road passenger and freight motor vehicle travel,
  4. energy use in the treatment and distribution of potable water and waste water, and 5) emissions from the collection and degradation of solid waste generated by the community”
“the use of publically available national datasets to form metropolitan emission estimates significantly reduces the time, funding, and human capital that would otherwise be required for a traditional ‘bottom-up’ inventory”

“We find that total 2014 metropolitan CO2 emissions range from 4.1 million metric tons in Lancaster, Pennsylvania to nearly 170 million metric tons in the Houston, Texas; with an overall average of 27 million metric tons.”

“Per capita emissions also show a wide variation: from 5 metric tons per person in the Tucson, Arizona to 65 metric tons per person in the Baton Rouge, Louisiana”

“cities might consider conducting inventories about every 5 years and shift a greater portion of their time and energy toward mitigation efforts in the interim.”

Tuesday, February 21, 2017

Air Pollution from Cruise Ships in Port and at Sea

Hoping for a fresh sea breeze aboard a cruise ship? Better hold your nose! (Karin Jäger, DW Environment, Jan. 26, 2017)

Also discussed here: NABU Cruise Rankings 2016 : Cruise ships fall short in environmental protection (MARES, Sep. 1, 2016)

And here: This stinks! - Clean up cruise ships! NABU's campaign for a cleaner cruise industry (10 page pdf, NABU Background Cruise Ships, 2015))

And here: NABU measures air pollution in ports (NABU)

And here: Scrubbers – An economic and ecological assessment (45 page pdf, Eelco den Boer, Maarten 't Hoen, DELFT for Naturschutzbund Deutschland (NABU), Mar. 13, 2015)

And here: The 0.1% sulphur in fuel requirement as from 1 January 2015 in SECAs (30 page pdf, European Maritime Safety Agency, Dec. 13, 2010)

Today we review examples of pollution from cruise ships both in port and now with previously never measured pollution, at sea. One ship emits as much air pollution over the same distance travelled as 5 million cars. 38% of the NO2 and 19% of particulates in the major German cruise ship port, Hamburg, comes from maritime traffic. Only 80 ships out of 55,000 worldwide have scrubbers installed to reduce the back soot emitted. Most of the 14,000 ships sailing in European SECAs < Sulphur Emission Control Areas> every year switched to low sulphur fuels instead of installing scrubbers. The UN, through the International Maritime Organisation (IMO), has the mandate to regulate the maritime environment internationally through its International Convention for the Prevention of Pollution from Ships (so-called MARPOL protocol).

 cuise-ship-pollution  

Key Quotes:

 "Pamphlets lead you to believe that there are blue skies and white ships - a dream-like setting…The truth is that clouds of black soot are emitted from the funnels."

 “In 2014 worldwide 22 million passengers went on an ocean cruise…There are more than 35 new cruise ships with a total capacity of around 100,000 passengers that will be introduced to the European market until 2020. “

"Eighty percent of the fleet of ships operating in Europe either do not use any exhaust gas cleaning system or, to meet the minimum legal standards in Northern Europe, they simply use a scrubber to reduce the sulphur emissions.”

“One cruise ships emits as many air pollutants as five million cars on the same distance! This is because sea going vessels use heavy fuel oil for their engines, a fuel that on land would have to be disposed of as hazardous waste. Heavy fuel oil can contain up to 3,500 times more sulphur than diesel that is used for land traffic vehicles.”

“most ship emissions occur in immediate vicinity of the coast, from where they are carried far into the hinterland. On a global level, two thirds of all ship emissions are generated within 400 km from the coast”

“The port and its often celebrated cruise ship entries are a massive problem for the city of Hamburg. Thirty-eight percent of the nitrogen oxides and 19 percent of the particulate matter in the Hanseatic city are from maritime traffic,”

“The International Maritime Organisation (IMO) of the United Nations sets the international framework for the regulation of pollutant reductions in sea shipping traffic. Its International Convention for the Prevention of Pollution from Ships (so-called MARPOL protocol) defines in Annex VI the permissible limit values regarding sulphur and nitrogen oxides, and bans the deliberate emission of substances harmful to the ozone laye”

“- Today round about 80 ships out of 55,000 worldwide have scrubbers installed; according to industry insiders up to 300 additional systems are on order….The overall majority of the 14,000 ships sailing in European SECAs every year switched to low sulphur fuels (MGO) instead of installing scrubbers”

“NABU did air quality testings in different port cities, in particular next to cruise and ferry terminals….While 1,000 particles per cubic centimeter are harmless, NABU’s scientist found up to 400,000 (ppm/cm2) next to the terminals. Air pollution levels like this even surpass concentrations next to main roads with dense traffic between 50 to 80 times.”

Tuesday, January 17, 2017

The Impact of Traffic-Related Air Pollution on Cloud Formation

Effect of vehicular traffic, remote sources and new particle formation on the activation properties of cloud condensation nuclei in the megacity of São Paulo, Brazil (22 page pdf, Carlos Eduardo Souto-Oliveira, Maria de Fátima Andrade, Prashant Kumar, Fábio Juliano da Silva Lopes, Marly Babinski, and Eduardo Landulfo, Atmos. Chem. Phys., Nov. 24, 2016)

 Today we review research on the impact vehicle emissions have on cloud formation in the largest city in South America with a 20M population and 7 M vehicles. Such a concentration of emissions may have global impacts on precipitation. Cloud condensation nuclei in this city originate from three sources: vehicle emissions, biomass burning in the vast tropical forests and from sea-salt. Careful direct and indirect (lidart) measurements over a four month period revealed that vehicles were predominant in producing these nuclei with two diurnal maxima during rush hours.

  trap-and-clouds  

Key Quotes:

“Atmospheric aerosol is the primary source of cloud condensation nuclei (CCN). The microphysics and chemical composition of aerosols can affect cloud development and the precipitation process.”

 “The high concentrations of CCN in the air favor the formation of clouds with small droplets, which can lead to suppression of precipitation in shallow and short-lived clouds”

 “Primary aerosols are emitted into the atmosphere directly by anthropogenic and natural sources. In contrast, secondary aerosols are formed in the atmosphere through the nucleation of no- or low-volatile gases containing inorganic and organic compounds, followed by growth to larger particles”

 “With over 20 million inhabitants, the MASP [Metropolitan Area of São Paulo] is the biggest megacity in South America. Therefore, the MASP represents an important city for global-scale atmospheric studies. The MASP fleet comprises more than 7 million vehicles, which constitute one of the main sources of particles, together with a variety of industries and construction activities “

 “The PNCs [particle number concentration]were highest between 07:00 and 19:00 LT, whereas they were lowest between 19:00 and 07:00 LT (Fig. 2b), hereafter referred to as the daytime and nighttime periods, respectively. During the daytime period, PNCs were elevated, especially during the rush hours, which are primarily associated with vehicular emissions. However, CCN peaks showed the opposite behavior, CCN concentrations being higher during the afternoon and the nighttime period. “

 “in the MASP, the morning rush occurs between 07:00 and 10:00 LT, whereas the afternoon rush occurs between 17:00 to 20:00 LT. The decrease began, and the lower values of AR [Mean activation ratio] occurred, during the morning rush and formation of a secondary aerosol. Vehicular traffic and secondary aerosol formation constitute the main sources of particles in megacities such as the MASP”

 “The regional atmosphere is highly affected by vehicular traffic emissions, and lower by remote sources such as biomass burning and sea-salt transport.”

“Our results show the influence that vehicular traffic, long-range transport of sea salt, biomass-burning plumes and NPF events have on CCN properties”

Thursday, January 12, 2017

Are Regional (not Global) Interventions Needed to Reduce Impacts and Mitigate Climate Change?

Two people on the shore of the Pacific Ocean
The Rationale for Accelerating Regionally Focused Climate Intervention Research (17 page pdf, Michael C. MacCracken, Earth's Future, Nov. 14, 2016)

Today we review a proposal to focus on particular regions where effort to reduce climate impacts would be more effective and likely have fewer unintended negative consequences than efforts aimed at the globe as a whole. Included in the potential approaches are modifying arctic warming by injecting sulfate aerosols directly into the Arctic atmosphere, moderate the intensity of tropical cyclones by brightening cloud albedoes, slowing the melting of Greenland and Antarctic ice sheets by blocking ice streams, and compensate for the reduced cooling from SO2 emissions in Asia by brightening the Pacific Ocean.

Key Quotes:

“Global-scale climate intervention is seen as a potential emergency backstop, even though the impacts from initiating melting of the polar ice sheets and biodiversity loss may well be irreversible and even undertaking testing steps in the intervention process outside the laboratory are controversial, at best”

 “model-based simulations ..… project global average temperature to increase to 3-4ºC above its preindustrial level by 2100 “

“surface-based approaches to altering energy flows as a means for moderating adverse regional impacts might well pose less difficult governance challenges and more regionally constrained evaluations of intended outcomes and unintended consequences. “ “near-term reductions in positive radiative forcing could most rapidly be achieved by reducing the atmospheric loadings of short-lived species (particularly methane, black carbon, and tropospheric ozone). “

 “The potential for moderating amplified Arctic warming:
  • high-latitude injection of sulfate aerosols into the stratosphere not only cooled the Arctic, but also, due to their roughly one-year half-life, spread to sub-Arctic latitudes and depressed the summer monsoon.
  • Potential approaches ....include brightening land, ocean, and clear and/or cloudy skies during the sunlit season .. reversing the warming influence caused by reducing air pollutant emissions flowing into the region … and, during the fall and winter seasons, cirrus thinning … bypassing the thermal barrier created by the sea ice ..and ice thickening by pumping sea water up onto existing sea ice.”
“The potential for moderating ocean warming in the tropical cyclone intensification zones:
* moderate the intensification effect of warmer ocean waters in only a few specific regions, so the amount of sea salt and/or sulfate aerosols needed to brighten clouds in only a few regions might well remain within reasonable bounds”

“The potential for slowing mass loss from the Greenland and Antarctic Ice Sheets:
*In addition to approaches involving physically blocking the exits of ice streams that may well be unworkable, approaches to consider might include cloud brightening, injection of reflective bubbles, and vertical mixing to lower the temperature of the waters that are observed to be inducing melting at the faces of ice streams. “

“The potential for a regional replacement for the loss of global sulfate cooling:
  • the centroid of the 0.5-1.0ºC cooling influence resulting from SO2 emissions has moved from the North Atlantic basin to southern and eastern Asia, a region where the per-ton-of-emission influence of SO2 emissions is likely larger due to the higher amounts of incoming solar radiation
  • inducing modest clear and cloudy sky brightening in the troposphere over the vast Pacific Ocean that would cause changes in the global energy balance comparable to those induced by the present highly concentrated, health-damaging sulfate loading presently centered over China, India, and downwind would seem to be possible as an alternative global-scale climate intervention”

Tuesday, December 20, 2016

How Can The US Transportation Become Carbon Free by 2050?


Also discussed here: Report: Global Warming Solutions (Environment America Research & Policy Center, Oct. 24, 2016)

Today we review a report that recommends 50 steps aimed at state and federal program and policies that could make the USA’s transportation system carbon free by 2050. The steps include making carbon reduction strategies a key priority by exploiting the growth of electric vehicles, autonomous vehicles and the sharing of cars and bicycles, adding more effective public transit, employing smart pricing policies and phasing out carbon intensive vehicles and fuels.

 co2-emissions-by-country  
Key Quotes:

“Efficient electric vehicles that can be powered by clean, renewable electricity are entering the marketplace faster than the hybrid cars of a decade ago “

“An explosion of technology-enabled services – from carsharing to bikesharing to Lyft and Uber – has begun to revolutionize transportation in many cities. “

 “Public transportation reduces vehicle travel (and greenhouse gas emissions) by about 10 percent in U.S. cities, and cities across the country are considering bold plans to expand access to high-quality transit.”

“Cities around the world have shown that smart pricing policies can reduce congestion and encourage the use of low-carbon modes of travel.”

 “autonomous vehicles can be deployed in ways that can support efforts to reduce greenhouse gas emissions – especially if they facilitate the use of shared mobility services, vehicle electrification and smart pricing, and if public policy limits any increases in vehicle travel resulting from automation.”

 “Principles:
  • Climate concerns should inform every transportation policy decision…Only seven states have enforceable, economy-wide limits on carbon pollution, and, as of 2012, the vast majority of states and metropolitan planning organizations did not even consider greenhouse gas emissions in agency planning processes.
  • Low-carbon transportation should be at the front of the line for public funding … Between 1956 and 2014, 79 percent of all government capital expenditures on transportation went toward highways,
  • People should be rewarded for making low-carbon transportation choices….income tax exclusion for commuter parking subsidizes rush hour driving to the tune of more than $7 billion per year.
  • Carbon-intensive vehicles and fuels should be phased out…Federal policies have failed to tap the potential of lower-carbon fuels, with the federal Renewable Fuels Standard currently serving largely to encourage the use of corn ethanol
  • Public policy should encourage climate-friendly communities…some localities have begun to lift mandatory minimum parking requirements that add to the cost of new housing development and consume precious and limited urban space.
  • Public policy should foster innovation…Key state and federal policies hamper innovation by failing to account for changing circumstances such as the emergence of shared mobility services or growing demand for urban living, or by locking officials into spending or policy practices more attuned to the needs of a previous generation.”

Thursday, December 8, 2016

How Can Transportation in the USA Become Carbon Free by 2050?


Also discussed here: Report: Global Warming Solutions (Environment America Research & Policy Center, Oct. 24, 2016)

Today we review a report that recommends 50 steps aimed at state and federal program and policies that could make the USA’s transportation system carbon free by 2050. The steps include making carbon reduction strategies a key priority by exploiting the growth of electric vehicles, autonomous vehicles and the sharing of cars and bicycles, adding more effective public transit, employing smart pricing policies and phasing out carbon intensive vehicles and fuels. co2-emissions-by-country  

Key Quotes:

“Efficient electric vehicles that can be powered by clean, renewable electricity are entering the marketplace faster than the hybrid cars of a decade ago “

 “An explosion of technology-enabled services – from carsharing to bikesharing to Lyft and Uber – has begun to revolutionize transportation in many cities. “

“Public transportation reduces vehicle travel (and greenhouse gas emissions) by about 10 percent in U.S. cities, and cities across the country are considering bold plans to expand access to high-quality transit.”

“Cities around the world have shown that smart pricing policies can reduce congestion and encourage the use of low-carbon modes of travel.”

 “autonomous vehicles can be deployed in ways that can support efforts to reduce greenhouse gas emissions – especially if they facilitate the use of shared mobility services, vehicle electrification and smart pricing, and if public policy limits any increases in vehicle travel resulting from automation.”

“Principles:
  • Climate concerns should inform every transportation policy decision…Only seven states have enforceable, economy-wide limits on carbon pollution, and, as of 2012, the vast majority of states and metropolitan planning organizations did not even consider greenhouse gas emissions in agency planning processes.
  • Low-carbon transportation should be at the front of the line for public funding … Between 1956 and 2014, 79 percent of all government capital expenditures on transportation went toward highways,
  • People should be rewarded for making low-carbon transportation choices….income tax exclusion for commuter parking subsidizes rush hour driving to the tune of more than $7 billion per year.
  • Carbon-intensive vehicles and fuels should be phased out…Federal policies have failed to tap the potential of lower-carbon fuels, with the federal Renewable Fuels Standard currently serving largely to encourage the use of corn ethanol
  • Public policy should encourage climate-friendly communities…some localities have begun to lift mandatory minimum parking requirements that add to the cost of new housing development and consume precious and limited urban space.
  • Public policy should foster innovation…Key state and federal policies hamper innovation by failing to account for changing circumstances such as the emergence of shared mobility services or growing demand for urban living, or by locking officials into spending or policy practices more attuned to the needs of a previous generation.”

Thursday, November 24, 2016

How Can Cities Reduce Methane Emissions?

Mitigation of methane emissions in cities: how new measurements and partnerships can contribute to emissions reduction strategies (39 page pdf, Francesca M. Hopkins, James R. Ehleringer, Susan E. Bush, Riley M. Duren, Charles E.Miller, Chun-Ta Lai, Ying-Kuang Hsu, Valerie Carranza, James T. Randerson, Earth’s Future, Sep. 10, 2016)

Today we review research into methane emissions from cities which along with other greenhouse gases contributes to climate warming. Cities themselves account for 70% of GHG emissions globally. Unlike CO2 however, methane emissions are more easily managed at the city level whether they come from transportation and the increased shift to natural gas as a fuel for city vehicles or, secondarily, from landfills where methane is emitted from decomposing organic materials or, thirdly, from leaks in the systems delivering natural gas to users. One of the major problems is the lack of accurate inventories of methane emissions which in some cities results in an underestimate of 50%. Some efforts being made in the transportation sector to reduce CO2 emissions include shifts to the use of propane or natural gas but these may have unintended consequences in terms of their contribution as a radiatively active gas to the greenhouse effect. Landfill emissions may be reduced by simply reducing the amount of waste generated though pricing of garbage or encouraging home composting.

 methane-emissions  

Key Quotes:

“Methane differs from CO2 in that mitigation is technologically and economically feasible… Unlike CO2, a large fraction of methane is lost as fugitive emissions from engineered systems, such as leaks from natural gas pipelines.”

 “some strategies to reduce CO2 emissions, such as substituting natural gas for other fossil fuels such as coal and diesel, may have the unintended consequence of increasing radiative forcing by increasing fugitive methane emissions.. methane emission rates are currently underestimated in greenhouse gas inventories … and thus it is unclear if switching to methane-based fuels provides a net benefit for climate mitigation.”

“the most important sectors for urban methane emissions are energy, waste, agriculture, and transportation, respectively …Energy and transportation primarily emit fossil methane derived from natural gas, whereas waste treatment and agriculture produce biogenic methane from the process of anaerobic decomposition”

“Natural gas vehicle use has grown rapidly over the past decade, and will continue to grow globally, particularly in developing countries in South Asia and Latin America …In the United States, use of natural gas as a transportation fuel is growing most rapidly for heavy duty and mass transit vehicles”

“Methane production can be prevented by reducing the amount of waste that ends up in landfills— cities have implemented this approach with pay-as-you-throw pricing and diversion of organic waste to alternative treatment such as composting”

 “Methane from wastewater is the fastest growing emission source outside of fossil fuels, expected to increase by 19% over the next two decades as population grows, particularly in developing economies”

“recent studies have used CO and CO2 inventories to quantify methane emissions in Los Angeles, revealing emissions up to 50% larger than inventory estimates”

Thursday, November 10, 2016

Can the Paris Agreement on Climate Change Work?

Carbon emissions from various global regions d...
Carbon emissions from various global regions during the period 1800–2000 AD (Photo credit: Wikipedia)
The Paris Agreement and the New Logic of International Climate Politics (28 page pdf, Robert Falkner, International Affairs, Aug.31, 2016) 

Today we review an analysis of the international negotiations from the top-down 1996 Kyoto Accord that today applies only to 15% of global carbon emissions, to the 2009 Copenhagen Accord that failed to reach consensus on a global emission reduction goal but managed to provide an umbrella for all participating countries for future negotiations. To the bottom-up Paris Agreement in 2015, signed by 195 nations, combines domestic politics with international commitments through a “naming and shaming” approach, voluntary national commitments, rachet-up reviews every five years and, perhaps most importantly, definition of a long term goal to reach “net-zero” emissions or “emission neutrality” between 2050 and 2100. As these voluntary commitments would result in a global warming of 2.7 C above pre-industrial levels, further reductions beyond the pledges are needed. The author cautions that “the Paris Agreement cannot be expected to ‘fix’ the climate problem; it can only provide a supportive framework within which states and other actors can achieve the required emissions cuts.”

Key Quotes: 

 “that global GHG emission levels, which were at 52.7 gigatonnes (GT) of carbon dioxide equivalent in 2014, should be brought down to 48 GT by 2025, and 42 GT in 2030. Carbon dioxide emissions alone will need to be reduced to net zero — by 2060–2075 (from 35.5 GT in 2014)” 

“Low-lying island states face an existential threat from rising sea levels while others, especially countries near the Arctic Circle, may experience greater agricultural output and easier access to natural resources as a result of the thawing of permafrost.” 

 “the number of climate change laws and policies worldwide doubled every five years since 1997, with 426 climate change laws and policies in place by the time of the 2009 Copenhagen conference, rising to 804 by the end of 2014.Interestingly, this applies not just to Annex I countries, which have traditionally led the way in climate legislation, but also to non-Annex I countries” 

“the careful wording of key provisions ensures that only some create legal obligations (‘shall’) while others merely express recommendations (‘should’) or create expressions of intent or opinion (‘will’, ‘recognize’).Thus, once the agreement has entered into force, parties will be legally obliged to submit NDCs and report on them every five years, but failure to comply with their own national climate plans will not constitute a breach of international law” 

“Naming and shaming mechanisms operate within diverse global governance contexts, from the International Labour Organization to human rights bodies and corporate social responsibility institutions.They are usually seen as a fallback mechanism where formal compliance and enforcement mechanisms are unavailable or fail to work. “ 

“it is clear that the within the new logic of nationally determined climate action, the Paris Agreement cannot be expected to ‘fix’ the climate problem; it can only provide a supportive framework within which states and other actors can achieve the required emissions cuts. “  

Tuesday, November 8, 2016

Measuring Exposure to Urban Air Pollution Where People Work rather than Where they Live.

The Impact of Mobile-Device-Based Mobility Patterns on Quantifying Population Exposure to Air Pollution (11 page pdf, Marguerite Nyhan, Sebastian Grauwin, Rex Britter, Bruce Misstear, Aonghus McNabola, Francine Laden, Steven R. H. Barrett, and Carlo Ratti, Environmental Science and Trechnology, Aug. 12, 2016)

Also discussed here: Air pollution threat hidden as research 'presumes people are at home': study (The Guardian, Aug. 24, 2016)

And here: Urban air pollution is worse than we think—but better data might solve the problem (Barbara Eldredge, CURBED, Aug. 30, 2016)

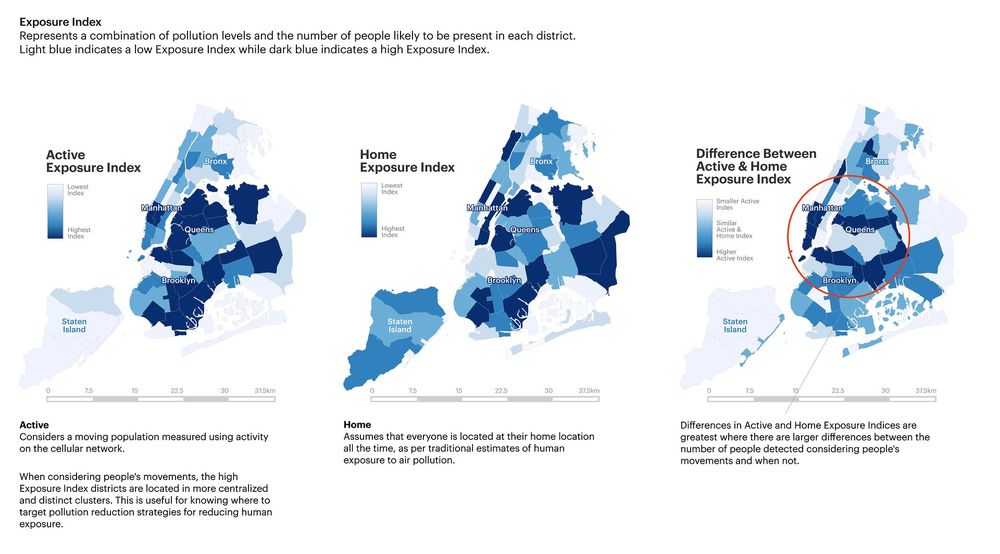
Today we review research into a study in New York City that compared the exposure to urban air pollution during an active day at the place of work and travelling to that rather than as earlier exposure studies have done only at the place of residence. The results indicate, first of all, that the highest concentration of PM2.5 is not surprisingly in central Brooklyn and Queens and in the southern half of Manhattan Island. Pollution levels at places of work compared to those at residences was 10 μg/m3 higher which suggests that a higher congestion charge be applied to vehicles which enter the high emission zones (which is the basis for the [present congestion charge zone in London, UK) .Future applications of this research when self driving cars are the norm might involve automatically controlling their movement to avoid adding to the pollution levels in some packets of the city

 air-pollution-smart-city-mit-study-nyhan-3  

Key Quotes:

“By harnessing cellular network information, researchers can see where urban populations move throughout the day, leading to better understanding of exposure to pockets of pollution. The MIT study focused on a particularly pernicious airborne particle, PM2.5—which is linked to asthma, heart disease, and poor lung function”

“This aim of this study was to quantify population-weighted exposure to air pollution by combining extensive population activity patterns and air pollution measurements. to evaluate population-weighted exposure to PM2.5 for New York City (NYC) and for 71 districts within the city”

“The districts where the population-weighted PM 2.5 exposures are relatively higher are very clearly located within Midtown and Lower Manhattan, and centralized areas of Brooklyn and Queens…This was a result of higher proportions of New Yorkers spending time in busy districts for employment, recreational, and social activities “

“more incidences of PM 2.5 values lower than 10 μg/m3 in the Home scenario are observed in comparison to the Active scenario, in which more PM 2.5 exposure values greater than 10 μg/m3 are seen.”

 “While evaluating where people are exposed to air pollution in the future using mobile phone based population activity estimates, this could assist in identifying where people are being exposed to levels above the WHO recommended limits. [10 μg/m3 in annual mean PM 2.5] exposure”

 “One of the novelest future contributions from this research is that geo-referenced digital phone traces can also be used to decipher individual trajectories. Therefore, personal air pollution exposure studies could be conducted on cohorts incorporating locations of exposure through mobile phone and wireless device trace data. “