Showing posts with label Standards/Regulations. Show all posts

Thursday, January 19, 2017

Do Trees in Cities Help or Harm Our Health?

Air pollution: outdoor air quality and health (National Institute for Health and Care Excellence, Dec.1, 2016)

Also discussed here: Trees could make urban pollution even worse (quartz, Dec.6, 2016)

And here: Neighborhood greenspace and health in a large urban center (Nature, Scientific Reports, Jul. 9, 2015)

Today we review a guide about urban air pollution that looks into the role that street trees play with respect to reducing air pollution. The overall conclusion was that trees are unlikely to reduce air pollution and could add to it, especially if the trees reduce ventilation of air currents. This is true also of the more recent use of green walls. It is also acknowledged [in a Toronto study]that urban trees can improve health – as much as a $10,000 raise or feeling 7 years younger. Pine trees are singled out as a particular contributer to urban pollution through their emissions of volatile organic compounds (VOC) which combine with the NO2 in car emissions to produce low level ozone, one of a handful of pollutants harmful to health.

 tree-area-toronto  

Key Quotes:

“Street trees were unlikely to reduce air pollution in most street designs and could worsen it in some cases,” “Leaves and branches slow air currents, causing pollutants to settle out.”

“Urban trees and plants can improve mental and physical health - an average of 10 extra trees per block made people living there feel like they would be much healthier—as much as a $10,000 raise or being seven years younger would”

“not all trees are equal. The pungency of a cedar, eucalyptus, or pine woodland, to name a few examples, comes from a blend of volatile organic compounds (VOC) in these species. When these VOCs interact with the nitrogen oxide that is in car emissions, in the presence of sunlight, they produce ozone—at ground level, the pollutant can be harmful enough to cause heart disease.”

“having 10 more trees in a city block, on average, improves health perception in ways comparable to an increase in annual personal income of $10,000 and moving to a neighborhood with $10,000 higher median income or being 7 years younger. … having 11 more trees in a city block, on average, decreases cardio-metabolic conditions in ways comparable to an increase in annual personal income of $20,000 and moving to a neighborhood with $20,000 higher median income or being 1.4 years younger.”

“In 2010 the total mortality burden of human-produced PM2.5 in London was 9 52,630 life-years lost and of long-term exposure to NO2 was up to 88,113 life-years 10 lost …The health impact of PM2.5 pollution from human activities in the UK is estimated to 15 cost between £8.5 billion and £18.6 billion a year “

“Where solid barriers are planned alongside major roads (sometimes 10 used to protect local people from noise) consider whether action is 11 needed to mitigate any adverse effects on air quality…Take into account the effect that trees can have on street ventilation, based on where they are planted and how they are maintained, to avoid creating areas of poorer air quality.”

 “Evidence showed that street trees and green walls or roofs have a mixed effect on 20 street air quality – in some cases they restrict street ventilation causing poorer air 21 quality, in others they improve it “

“Leaves and branches slow air currents, causing pollutants to settle out. They may also act as 'sinks' for particulates and chemicals that may have direct or indirect effects on air quality (in particular, volatile organic compounds [VOCs]). The extent to which this is the case depends on factors such as species, time of year and growing conditions.”

 “air quality might deteriorate at street level near vehicle sources if ventilation were restricted, while improving near first floor windows above the canopy. Although it is important to avoid the possible negative”

Tuesday, January 10, 2017

How Do Air Pollution Alerts Affect Public Health Use?

Effects of an air pollution personal alert system on health service usage in a high-risk general population: a quasi-experimental study using linked data (7 page pdf, R A Lyons, S E Rodgers, S Thomas, R Bailey, H Brunt, D Thayer, J Bidmead, B A Evans, P Harold, M Hooper, H Snooks, J Epidemiol Community Health, May 23, 2016)

Today we review an analysis of the reaction of an “intervention” group of patients with air pollution- related illnesses (cardio-respiratory and COPD) to alerts produced by the UK’s airAware alert system over a two year period, as measured by visits to hospital emergency departments, compared to a control group which were not similarly afflicted. Results indicate a doubling of emergency admissions and four times the number of respiratory conditions for the intervention group compared to the control group. The authors conclude that some health interventions or alerts beyond a certain distribution level are harmful in terms of health service utilisation.

 . air-alerts  

Key Quotes:

“The airAware system was a novel development because it integrated near real-time data rather than forecasting. Its design facilitated early identification of local air pollution problems and issued timely warnings of air pollution episodes reflecting levels of particulate matter (measured as particulate matter 10 μm or less in diameter”

“The number of messages per day was limited to three; on any single day no more than three alerts could be issued. Only one alert was issued for the day unless a higher pollution trigger level was met during the daily alerting period.”

“The intervention group experienced a doubling of emergency admissions for all relevant conditions and a fourfold admissions increase for respiratory conditions”

 “Our findings raise questions about the trade off between harms and benefits of air pollution alerting services. .. There is a growing evidence base demonstrating some public health interventions are harmful. Wider roll-out of such systems does not appear to be warranted given the current evidence base.“

Thursday, November 24, 2016

How Can Cities Reduce Methane Emissions?

Mitigation of methane emissions in cities: how new measurements and partnerships can contribute to emissions reduction strategies (39 page pdf, Francesca M. Hopkins, James R. Ehleringer, Susan E. Bush, Riley M. Duren, Charles E.Miller, Chun-Ta Lai, Ying-Kuang Hsu, Valerie Carranza, James T. Randerson, Earth’s Future, Sep. 10, 2016)

Today we review research into methane emissions from cities which along with other greenhouse gases contributes to climate warming. Cities themselves account for 70% of GHG emissions globally. Unlike CO2 however, methane emissions are more easily managed at the city level whether they come from transportation and the increased shift to natural gas as a fuel for city vehicles or, secondarily, from landfills where methane is emitted from decomposing organic materials or, thirdly, from leaks in the systems delivering natural gas to users. One of the major problems is the lack of accurate inventories of methane emissions which in some cities results in an underestimate of 50%. Some efforts being made in the transportation sector to reduce CO2 emissions include shifts to the use of propane or natural gas but these may have unintended consequences in terms of their contribution as a radiatively active gas to the greenhouse effect. Landfill emissions may be reduced by simply reducing the amount of waste generated though pricing of garbage or encouraging home composting.

 methane-emissions  

Key Quotes:

“Methane differs from CO2 in that mitigation is technologically and economically feasible… Unlike CO2, a large fraction of methane is lost as fugitive emissions from engineered systems, such as leaks from natural gas pipelines.”

 “some strategies to reduce CO2 emissions, such as substituting natural gas for other fossil fuels such as coal and diesel, may have the unintended consequence of increasing radiative forcing by increasing fugitive methane emissions.. methane emission rates are currently underestimated in greenhouse gas inventories … and thus it is unclear if switching to methane-based fuels provides a net benefit for climate mitigation.”

“the most important sectors for urban methane emissions are energy, waste, agriculture, and transportation, respectively …Energy and transportation primarily emit fossil methane derived from natural gas, whereas waste treatment and agriculture produce biogenic methane from the process of anaerobic decomposition”

“Natural gas vehicle use has grown rapidly over the past decade, and will continue to grow globally, particularly in developing countries in South Asia and Latin America …In the United States, use of natural gas as a transportation fuel is growing most rapidly for heavy duty and mass transit vehicles”

“Methane production can be prevented by reducing the amount of waste that ends up in landfills— cities have implemented this approach with pay-as-you-throw pricing and diversion of organic waste to alternative treatment such as composting”

 “Methane from wastewater is the fastest growing emission source outside of fossil fuels, expected to increase by 19% over the next two decades as population grows, particularly in developing economies”

“recent studies have used CO and CO2 inventories to quantify methane emissions in Los Angeles, revealing emissions up to 50% larger than inventory estimates”

Tuesday, November 22, 2016

The Future of the World and Cities in It

Indoor and Built Environment
Indoor and Built Environment (Photo credit: Wikipedia)
Urban futures: anticipating a world of cities (6 page pdf, Geci Karuri-Sebina, Karel-Herman Haegeman and Apiwat Ratanawaraha, Foresight, Sep. 10, 2016)


Key Quotes: 

“Modern urbanisation has led to a larger number of megacities (over 10 million inhabitants) and rapidly growing smaller towns and cities. In 1950, only two megacities existed in the world; New York-Newark (USA) and Tokyo (Japan). By 2015, it is reported that 35 megacities were in existence, the largest of these being Tokyo and Shanghai (China), each with populations of over 30 million inhabitants” 

“rapid urbanisation is hailed as being a transformative force, improving economic prospects and quality of life for the majority, alleviating poverty, driving innovation and productivity, working towards social inclusion and contributing to national and regional development“

 “On the other hand, there are also real tensions and contradictions that emerge. For example, similar to economic activity and growth, unemployment/joblessness and poverty are largely urban….they also remain the loci of major political conflicts, driven by racial and cultural tensions and diverging citizen values, which are increasingly propelled by the proliferation of digital media”

 “The trend of urbanisation is also accompanied by efforts in various parts of the world to decentralize political and administrative functions to local governments so as to enhance good governance.” 

“Urban challenges are tremendous, and the types of challenges addressed in anticipatory initiatives are seemingly suitably vast, ranging from sustainability, the built environment, energy, culture and mobility to security and food security, exposure to flood and drought hazards, values, multicultural aspects” 

“The 21st century will not be dominated by America or China, Brazil or India, but by The City. In a world that increasingly appears ungovernable, cities – not states – are the islands of governance on which the future world order will be built”  

Tuesday, November 15, 2016

Must Cities Shrink to be Sustainable, even with Increased Urbanization?

Sustainability for Shrinking Cities (9 page pdf, Dustin L. Herrmann, William D. Shuster, Audrey L. Mayer and Ahjond S. Garmestani, Sustainability, Editorial, Sep. 7, 2016)  

Today we review an overview (and editorial) focused on sustainability for cities in the face of increasing urbanization worldwide and to the recent trend toward shrinking cities because of economic depression and the hollowing out of city centres as a result. Many large growing, economically-healthy cities tend to replace urban greenspace and urban parkland with high income residential or commercial developments with significant negative impacts on a healthy environment. Shrinking economically poor cities on the other hand are faced with vacant downtown lots some of which steer toward sustainable cities through improved water filtration, dampening of urban flash floods and carbon sequestration. For many coastal cities, sea level rise and threats to human health from more frequent hot spells as a result of climate warming are other issues on cities to adapt sustainably with more thoughtful urban planning.

shrinking-city  

Key Quotes:  

“Observations of past urban dynamics indicate that cities commonly undergo contraction phases …though there remains a need to identify what a sustainable trajectory is for shrinking cities.”

 “a shrinking city can be considered one with a smaller population or economy compared with its past; although, even a threshold of time may invoke an arbitrary designation. Any definition of a shrinking city is confounded with the fact that cities are composed of parcels, streets and neighborhoods that can have different growth and shrinkage trajectories than that of the city in the aggregate”

 “A general goal for the shrinking city was suggested…. as “aligning a city’s built environment with the needs of existing and future populations by adjusting the amount of land available for development”. “In the U.S., the second half of the 20th century was marked by the urban decline era…which saw population loss from the city core via rapid suburbanization, which was facilitated by federal government backing of highway construction.”

 “The shift in urbanization in favor of dense, and arguably traditional, urban neighborhoods can create the circumstances for stabilization in shrinking cities.”

“One significant difference between growing and shrinking cities is the proportion of green space providing ecosystem services which can help accomplish sustainable city goals .. Growing cities experience a net loss of green space, as there is high competition for space with other urban uses. Shrinking cities conversely are faced with an increasing extent of green space, typically in the form of vacant land.”

 “the emerging green space could provide ecosystem services such as water filtration and carbon sequestration, and given appropriate governance are a resource shrinking cities can use to transition to sustainable trajectories”

“For shrinking cities (e.g., Cleveland) that wish to slow decline and stabilize for sustainability, catalyzing change in infrastructure from gray to green infrastructure is a path to facilitate transformation"

 “the issue of legacy soil lead burden in vacant lands … offers a new framing of the problem by promoting human (learning and knowledge), social (urban gardening), and technical (soil testing as a data feedback) capitals to mitigate against soil lead availability, and leverage available natural resources toward urban agroecosystems that benefit local communities.”

 “sea level rise has many of the same outcomes shrinking cities experience through population loss, such as compromised infrastructure and new public health risks experienced by vulnerable populations.”

 “mid-size cities, shrinking or growing, are unique compared to large cities because they are more reliant on local ecosystem services. As such, a strategy for countering shrinking in mid-size cities may be acknowledging and leveraging this reliance for greater flexibility.”

Thursday, November 10, 2016

Can the Paris Agreement on Climate Change Work?

Carbon emissions from various global regions d...
Carbon emissions from various global regions during the period 1800–2000 AD (Photo credit: Wikipedia)
The Paris Agreement and the New Logic of International Climate Politics (28 page pdf, Robert Falkner, International Affairs, Aug.31, 2016) 

Today we review an analysis of the international negotiations from the top-down 1996 Kyoto Accord that today applies only to 15% of global carbon emissions, to the 2009 Copenhagen Accord that failed to reach consensus on a global emission reduction goal but managed to provide an umbrella for all participating countries for future negotiations. To the bottom-up Paris Agreement in 2015, signed by 195 nations, combines domestic politics with international commitments through a “naming and shaming” approach, voluntary national commitments, rachet-up reviews every five years and, perhaps most importantly, definition of a long term goal to reach “net-zero” emissions or “emission neutrality” between 2050 and 2100. As these voluntary commitments would result in a global warming of 2.7 C above pre-industrial levels, further reductions beyond the pledges are needed. The author cautions that “the Paris Agreement cannot be expected to ‘fix’ the climate problem; it can only provide a supportive framework within which states and other actors can achieve the required emissions cuts.”

Key Quotes: 

 “that global GHG emission levels, which were at 52.7 gigatonnes (GT) of carbon dioxide equivalent in 2014, should be brought down to 48 GT by 2025, and 42 GT in 2030. Carbon dioxide emissions alone will need to be reduced to net zero — by 2060–2075 (from 35.5 GT in 2014)” 

“Low-lying island states face an existential threat from rising sea levels while others, especially countries near the Arctic Circle, may experience greater agricultural output and easier access to natural resources as a result of the thawing of permafrost.” 

 “the number of climate change laws and policies worldwide doubled every five years since 1997, with 426 climate change laws and policies in place by the time of the 2009 Copenhagen conference, rising to 804 by the end of 2014.Interestingly, this applies not just to Annex I countries, which have traditionally led the way in climate legislation, but also to non-Annex I countries” 

“the careful wording of key provisions ensures that only some create legal obligations (‘shall’) while others merely express recommendations (‘should’) or create expressions of intent or opinion (‘will’, ‘recognize’).Thus, once the agreement has entered into force, parties will be legally obliged to submit NDCs and report on them every five years, but failure to comply with their own national climate plans will not constitute a breach of international law” 

“Naming and shaming mechanisms operate within diverse global governance contexts, from the International Labour Organization to human rights bodies and corporate social responsibility institutions.They are usually seen as a fallback mechanism where formal compliance and enforcement mechanisms are unavailable or fail to work. “ 

“it is clear that the within the new logic of nationally determined climate action, the Paris Agreement cannot be expected to ‘fix’ the climate problem; it can only provide a supportive framework within which states and other actors can achieve the required emissions cuts. “  

Tuesday, November 8, 2016

Measuring Exposure to Urban Air Pollution Where People Work rather than Where they Live.

The Impact of Mobile-Device-Based Mobility Patterns on Quantifying Population Exposure to Air Pollution (11 page pdf, Marguerite Nyhan, Sebastian Grauwin, Rex Britter, Bruce Misstear, Aonghus McNabola, Francine Laden, Steven R. H. Barrett, and Carlo Ratti, Environmental Science and Trechnology, Aug. 12, 2016)

Also discussed here: Air pollution threat hidden as research 'presumes people are at home': study (The Guardian, Aug. 24, 2016)

And here: Urban air pollution is worse than we think—but better data might solve the problem (Barbara Eldredge, CURBED, Aug. 30, 2016)

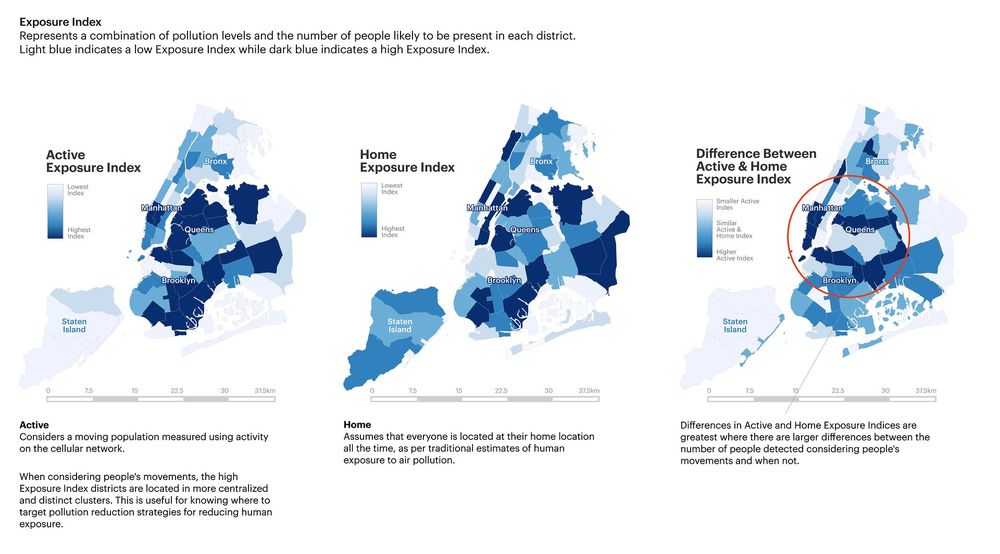
Today we review research into a study in New York City that compared the exposure to urban air pollution during an active day at the place of work and travelling to that rather than as earlier exposure studies have done only at the place of residence. The results indicate, first of all, that the highest concentration of PM2.5 is not surprisingly in central Brooklyn and Queens and in the southern half of Manhattan Island. Pollution levels at places of work compared to those at residences was 10 μg/m3 higher which suggests that a higher congestion charge be applied to vehicles which enter the high emission zones (which is the basis for the [present congestion charge zone in London, UK) .Future applications of this research when self driving cars are the norm might involve automatically controlling their movement to avoid adding to the pollution levels in some packets of the city

 air-pollution-smart-city-mit-study-nyhan-3  

Key Quotes:

“By harnessing cellular network information, researchers can see where urban populations move throughout the day, leading to better understanding of exposure to pockets of pollution. The MIT study focused on a particularly pernicious airborne particle, PM2.5—which is linked to asthma, heart disease, and poor lung function”

“This aim of this study was to quantify population-weighted exposure to air pollution by combining extensive population activity patterns and air pollution measurements. to evaluate population-weighted exposure to PM2.5 for New York City (NYC) and for 71 districts within the city”

“The districts where the population-weighted PM 2.5 exposures are relatively higher are very clearly located within Midtown and Lower Manhattan, and centralized areas of Brooklyn and Queens…This was a result of higher proportions of New Yorkers spending time in busy districts for employment, recreational, and social activities “

“more incidences of PM 2.5 values lower than 10 μg/m3 in the Home scenario are observed in comparison to the Active scenario, in which more PM 2.5 exposure values greater than 10 μg/m3 are seen.”

 “While evaluating where people are exposed to air pollution in the future using mobile phone based population activity estimates, this could assist in identifying where people are being exposed to levels above the WHO recommended limits. [10 μg/m3 in annual mean PM 2.5] exposure”

 “One of the novelest future contributions from this research is that geo-referenced digital phone traces can also be used to decipher individual trajectories. Therefore, personal air pollution exposure studies could be conducted on cohorts incorporating locations of exposure through mobile phone and wireless device trace data. “

Tuesday, October 18, 2016

What is Needed to Limit Global Climate Warming to 1.5C Using a Scenario Approach?

A Better Life with a Healthy Planet - Pathways to Net-Zero Emissions, A New Lens Scenarios Supplement (96 page pdf, Shell, May 2016)

Today we review a supplement to the Shell scenarios published in 2013 that examined steps toward a net zero energy future. The Shell scenario team became famous for their contributions to determining post-apartheid options for South Africa after 1990. It is a scoping document, starting with an estimate of the energy needs of the world in 2100 “for a better life”, based on a 50% population increase and a lowering of energy demand per person from as much as 300 gigajoules in USA/Canada to 100 GJ per person, as a world average – which amounts to a doubling of the global energy needs.

To accomplish this by 2050 and meet the Paris goal of limiting warming to 1.5 C, would require net zero emissions by that year and that, in turn, would require some form of negative carbon reduction, using technologies such as Carbon Capture and Storage (CCS) which would mean lowering its current high cost to around $30 per tonne by 2030- equivalent to wind power costs. Carbon pricing is seen as an absolute necessity to bring solar energy up to 40% of energy needs by 2060. It also requires 80% of passenger cars converted to electricity by 2030 and, in terms of land use, reducing drastically the amount of agricultural land used for feeding animals from the current 80%. For developing countries, investment in infrastructure and adapting to a solar society would allow them to leap-frog to net zero emissions as well.

 energy-future  

Key Quotes:

 “While we seek to enhance our operations’ average energy intensity through both the development of new projects and divestments, we have no immediate plans to move to a net-zero emissions portfolio over our investment horizon of 10–20 years”

“We begin with “where we are now”, ..We then summarise what we mean by “a better life with a healthy planet” and how the energy system may evolve in future to deliver those objectives: the necessary transformations in both the consumption and production side of the energy system; economic growth pathways in developing countries; and the policies needed to support those transformations.”

 “Energy: enabling the material basis for “a better life”… how much energy is needed for a better life?..if we assume a future population of around 10 billion people by the end of the century, and multiply it by a hundred gigajoules per capita, we see that the global energy need would be about 1,000 exajoules (one exajoule is equal to one billion gigajoules) a year – which is roughly twice the size of the current energy system”

“Four essential policy levers..:
  • Long-term policy frameworks that support and incentivise the building of necessary infrastructure to enable the take-up of new low-carbon materials and technologies…
  • Economy-wide carbon pricing – whether through carbon trading, carbon taxes or mandated carbon-emissions standards…
  • Policies that mitigate the negative effects of the transition on the most vulnerable sectors of the economy and segments of society…
  • Other financial support and incentives for low-carbon research and development, particularly for early-stage development and deployment of promising technologies across all key sectors. “
“Consumers will need to choose lighter cars with more efficient drives. They will need to employ heat pumps, LED lighting and other energy-efficient appliances as well as increase recycling…by choosing to live in compact cities, consumers lower demand for energy because they don’t need to travel as far.” “Many models could not limit likely warming to below 2°C if bioenergy, CCS and their combination (BECCS) are limited (high confidence).”

 “to limit the temperature rise to 3°C would require achieving net-zero emissions during the first half of the next century; 2.5°C would require net-zero emissions by 2100; 2°C would require net-zero emissions by around 2070; and 1.5°C would require net-zero emissions around 2050, followed thereafter by net-negative emissions.”

“In developed economies, the emerging standard for new buildings is “all-electric”. The combination of heavy insulation, triple glazing, electric boilers, heat pumps (effectively air conditioners working in reverse to heat a space) and rooftop solar PV power means that house builders can already build commercially viable, low-rise “net-zero energy” homes “

“Passenger road transport will be the easiest to electrify, with battery and fuel cell electric vehicles potentially reaching 80% of the global passenger car fleet over coming decades. EVs are particularly suited for short- and medium-distance travel in urban environments and densely populated regions,”

“the highest priority is to stop and reverse conversion of natural forests, peat-lands and high-carbon grassland to agricultural use.. the world must reduce emissions from rearing animals. 80% of agricultural land is used as pasture to feed animals.”

“to become the largest single primary energy source in the energy system by 2060, accounting for 40% of total primary energy…would require higher fossil-energy prices relative to solar, significant innovation in technology.., worldwide markets of solar products that appeal to the rich as well as the poor, a high electrification of stationary energy uses and a commitment by many people worldwide to sustainable sources of energy.”

 “By adopting new technologies and production processes, shifting to new energy sources and investing in the necessary enabling infrastructure, lower income countries could “leapfrog” to a net-zero emissions economy.”

 “keeping to a 2°C pathway would cost global society approximately 140% more without CCS. CCS is a capital-intensive technology….Commercial viability for a CCS plant would currently require a mechanism (for example, a carbon price) to reward capture and storage of CO2 at over $100 per tonne, but this cost could decline to around $70 per tonne in the early 2030s as more CCS plants are built and the supply chains they rely upon mature. This would put the price of CCS-based power generation from natural gas on a par with offshore wind.”

Monday, September 26, 2016

Which Countries Have the the Most and Least Sustainable Cities?

A Global Perspective on the Sustainable Performance of Urbanization (16 page pdf, Liyin Shen, Chenyang Shuai, Liudan Jiao, Yongtao Tan and Xiangnan Song, Sustainability, Aug. 11, 2016)

Today we review a comparison of 111 countries, according to how well they perform in urban sustainability, made up of indices of environmental, economic and social sustainability. The best overall performers are developed countries in Western Europe, the worst in Africa and Asia. It is notable that although Sweden is not the top performer in any one of the three indices, it is the best overall, signaling how well that country balances the three aspects.

  urban-sust  

Key Quotes:  

" Urbanization has been identified as one of the most important strategies for development in the 21st century… According to the World Bank, ..the ratio of urban populations at a global level has already exceeded 50% in 2007 and this will continue to rise in the coming decades”

 “Sustainable urbanization can be defined as “urbanization practice that complies with sustainable development principles that combines environmental, social, and economic sustainability”

“the selected countries are ranked according to their overall performance in implementing sustainable urbanization, with the top five performers being Sweden, Norway, Germany, the Netherlands, and Demark, and the five worst countries being Mozambique, Nigeria, Togo, Yemen, and the Democratic Republic of the Congo.”

“in the environmental dimension, the top five performers are Norway, Sweden, Romania, Denmark, and Germany, and the worst five are Nigeria, Tajikistan, Saudi Arabia, India, and Syria.” “when the economic dimension is considered, Luxembourg, the Netherlands, Sweden, Switzerland, and Norway are the best five, and the Democratic Republic of the Congo, Mozambique, Yemen Namibia, and Tajikistan are the five poorest.”

“from the perspective of social sustainability, Singapore, Germany, Switzerland, Sweden, and Japan are the best five, while the Democratic Republic of the Congo, Cote d’Ivoire, Angola, Togo, and Mozambique are the worst five”

“the best performers in terms of overall sustainable urbanization during the surveyed period are Sweden, Norway, Germany, the Netherlands, and Denmark. The best performers are mainly developed countries in Europe. Other good performers include Brazil, Romania, and Thailand. Poor performers are mainly distributed in Africa and Asia.”

 “there is a negative correlation between urbanization rate and sustainable performance when urbanization is at the initial stage, and a positive correlation when urbanization is at the acceleration stage.”