Showing posts with label economic. Show all posts

Thursday, December 22, 2016

Does Air Pollution Affect the Stock Market?

The main trading room of the Tokyo Stock Excha...
The Effect of Air Pollution on Investor Behavior: Evidence from the S&P 500 (Abstract, Anthony Heyes, Matthew Neidell, Soodeh Saberian, National Bureau of Economic Research, Oct. 26, 2016)

Also discussed here: Why investors may want to keep tabs on air pollution (CBS News, Oct. 26, 2016) 


 Today we review several reports that look at the links, if any, between investment returns and short term changes in local air quality, as examined in the stock exchanges of the USA, Italy and China. There is some evidence that higher levels of fine particulate matter may reduce one day returns by almost 12%. Also, when the trading floor is near or within an area of higher air pollution, trading activity is affected.

Key Quotes:

“We hypothesize that pollution decreases the risk attitudes of investors via short-term changes in brain and/or physical health,”

“Unlike other common air pollutants -- which either remain outside or break down very rapidly once indoors -- going inside reduces one’s exposure to [fine particulate matter] only minimally…a one standard deviation increases in ambient PM2.5 reduces same-day returns by 11.9%”

“We find {USA] that air pollution is negatively related to stock returns, even when controlling for other variables. The relationship becomes weaker as the distance of the stock exchange from the polluted area increases.”

“we document the existence of an air pollution effect only when trading is conducted on the floor, which provides evidence in support of the view that the air pollution effect is at least partly mediated by the behavior of the trading floor community.”

“Our results [China] indicate that asset returns are unaffected by changes in mood introduced by factors including the weather and the onset and recovery from SAD… we show that in an order-driven market, environmental impacts on sentiment are likely to affect trading activities, but not returns.”

Tuesday, December 6, 2016

What Happens to Coastal Cities Vulnerable to Sea Level Rise?

Adapting to rates versus amounts of climate change: a case of adaptation to sea-level rise ( 9 page pdf, Soheil Shayegh, Juan Moreno-Cruz and Ken Caldeira, Environmental Research Letters, Oct. 4, 2016)

Today we review the most immediate aspect of climate change- its impact in terms of sea level rise and how best to adapt to this financially, given that many coastal cities are threatened including London, New York, and Tokyo. The authors consider four scenarios given the current rate of rise of 44 cm/100 years which is expected to increase by almost a factor of ten to 344 cm/100 years as Antarctic ice continues to melt over the next 1,000 years for a 60 m rise in sea level. The scenarios include: taking no action, creating a buffer zone, adapting to change in rise and building dikes to withstand increased sea levels. The optimum distance from the sea for safety increases from 310 m to 481 m as the rate of rise of sea level doubles. Insurance based on static risk need to be revised to a more flexible approach based on rate of rise.

 aea-level-riase-and-adaptation  
Key Quotes:

“climate is likely to continue changing far into the future. Here, we show how considering rates of change affects the projected optimal adaptation strategy.”

“Recent studies indicate that sea-level may continue to rise for millennia, ultimately leading to up to 60mof sea-level rise” “optimal investment strategies depends on taking into account future rates of sea level rise, as well as social and political constraints….Unrestrained fossil-fuel combustion with release of CO2 to the atmosphere has the potential to ultimately melt all of Antarctica at rates of sea-level rise averaging up to 3 cmyr−1 over the next 1000 years “

“Over the next 1000 years, sea-level is projected to rise at an average rate of 3.44 cm yr−1, if all available fossil fuel resources are combusted and the CO2 released to the atmosphere”

 “In the scenarios where rate of change is taken into account …, the optimal distance from the shoreline for investment increases from 310 to 481m as the rate of sea-level is doubled from 1 to 2 cm yr“

 “Failure to recognize the need for adapting to the rate of climate change undervalues the benefits of early adaptation strategies and increases vulnerability to climate change.”

“Flood insurance policies traditionally estimate the likelihood of a flood by assigning a probability to such event. New insurance policies can be designed by taking into account the ongoing rate of sea-level and updating the flood likelihood.”

Thursday, December 1, 2016

How do Travel Demand and Economics Affect the Development of Urban Road Networks?

A Model of the Rise and Fall of Roads (33 page pdf, Zhang, Lei, Levinson, David M, Systems Symposium at the Massachusetts Institute of Technology, Mar. 2004)

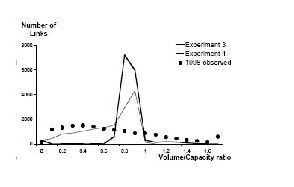
Today we review a seminal paper from over a decade ago that examines the dynamics of road development in a major mid-West American city (Minneapolis-Saint Paul) using a model that combines measures such as travel demand statistics (usually found on Origin Destination studies) with the economics of road pricing or tolls, geographical constraints (such as rivers and mountains) and how these change with newer technology over time (in this case over 20 years). Roads represent both figuratively and physically the link that join the issues addressed in this blog: how traffic is linked to pollution and how pollution is linked to health. Of particular interest is the way that travel demand and road volume capacity (VC) interact with road tolls and the cost of road construction and the resulting revenue that may be used to ease congestion, in addition to the overall design of the road network and design for a major urban area. road-links  

Key Quotes:

 “In 1900 there were 240 km of paved road in the United States … and this total had increased to 6,400,000 by 2000 …with virtually 100% of the U.S. population having almost immediate access to paved roadways.”

“questions yet to be answered: (1) How do the existing links (roads) develop and degenerate? (2) How are new links added to the existing network? (3) How are new nodes added to the existing network?” “the Twin Cities transportation network which comprises nearly 8,000 nodes and more than 20,000 links, using network data collected since year 1978”

Specific questions on the rise and falls of roads:
  1. “Why do links expand and contract?
  2. Do networks self-organize into hierarchies?
  3. Are roads (routes) an emergent property of networks?
  4. What are the parameters to be calibrated in a microscopic network dynamics model?
  5. Is the model computationally feasible on a realistic transportation network?
  6. Is the model capable of replicating real-world network dynamics?”
“economic growth is a two-way interaction between the economy and technology; technological research transforms the economy that finances it.. transportation investment drives the growth that funds it.” “In developed countries where transportation infrastructure has reached its saturated stage, it is rare to see new network growth from a tabula rasa. Even in an empty place without any previous developments, natural barriers such as rivers and mountains still impose constraints on future network growth.”

“Longer, faster, and high-demand (traffic flow) links should be able to generate more revenues. If not maintained appropriately, link LOS [Level of Service] will decrease over time due to physical deterioration caused by the environment and traffic.”

“link expansion cost is positively correlated to lane-miles of expansion and road hierarchy (interstate, state highway, county highway, etc.), while negatively related to the distance from the nearest downtown” “most roads carry flows well below their capacity and a few roads operate at VC [volume capacity] ratios near or slightly higher than one. Practically, over a long period of time, no road can carry flows more than its capacity.”

 “some important system properties, such as road hierarchies and self-organization in transportation networks, can be predicted through a microscopic evolutionary process, a demonstration that such a microscopic agent-based model of network dynamics can be feasibly applied to large-scale realistic transportation networks, and an enquiry into how this concept can be realized and produce useful modeling tools for planners.”

Monday, September 26, 2016

Which Countries Have the the Most and Least Sustainable Cities?

A Global Perspective on the Sustainable Performance of Urbanization (16 page pdf, Liyin Shen, Chenyang Shuai, Liudan Jiao, Yongtao Tan and Xiangnan Song, Sustainability, Aug. 11, 2016)

Today we review a comparison of 111 countries, according to how well they perform in urban sustainability, made up of indices of environmental, economic and social sustainability. The best overall performers are developed countries in Western Europe, the worst in Africa and Asia. It is notable that although Sweden is not the top performer in any one of the three indices, it is the best overall, signaling how well that country balances the three aspects.

  urban-sust  

Key Quotes:  

" Urbanization has been identified as one of the most important strategies for development in the 21st century… According to the World Bank, ..the ratio of urban populations at a global level has already exceeded 50% in 2007 and this will continue to rise in the coming decades”

 “Sustainable urbanization can be defined as “urbanization practice that complies with sustainable development principles that combines environmental, social, and economic sustainability”

“the selected countries are ranked according to their overall performance in implementing sustainable urbanization, with the top five performers being Sweden, Norway, Germany, the Netherlands, and Demark, and the five worst countries being Mozambique, Nigeria, Togo, Yemen, and the Democratic Republic of the Congo.”

“in the environmental dimension, the top five performers are Norway, Sweden, Romania, Denmark, and Germany, and the worst five are Nigeria, Tajikistan, Saudi Arabia, India, and Syria.” “when the economic dimension is considered, Luxembourg, the Netherlands, Sweden, Switzerland, and Norway are the best five, and the Democratic Republic of the Congo, Mozambique, Yemen Namibia, and Tajikistan are the five poorest.”

“from the perspective of social sustainability, Singapore, Germany, Switzerland, Sweden, and Japan are the best five, while the Democratic Republic of the Congo, Cote d’Ivoire, Angola, Togo, and Mozambique are the worst five”

“the best performers in terms of overall sustainable urbanization during the surveyed period are Sweden, Norway, Germany, the Netherlands, and Denmark. The best performers are mainly developed countries in Europe. Other good performers include Brazil, Romania, and Thailand. Poor performers are mainly distributed in Africa and Asia.”

 “there is a negative correlation between urbanization rate and sustainable performance when urbanization is at the initial stage, and a positive correlation when urbanization is at the acceleration stage.”

Thursday, September 22, 2016

Does Air Pollution Affect Productivity?

The Effect of Pollution on Worker Productivity: Evidence from Call-Center Workers in China (Abstract, Tom Chang, Joshua Graff Zivin, Tal Gross, Matthew Neidell, NBER Working Paper No. 22328, Jun. 2016)

Also discussed here: The effect of pollution on worker productivity: Evidence from call-centre workers in China (Tom Chang, Tal Gross, Joshua Graff Zivin, Matthew Neidell, VOX- CEPR’s Policy Portal, Jul. 15, 016)

And here:Pollution is bad for your health, but is it also making you less productive? (Tal Gross, Tom Chang, Joshua Graff Zivin, Matthew Neidell, World Economic Forum, Jul. 25, 2016)

Today we review research that looks at how the productivity of call workers in China was affected by higher levels of pollution. Results indicate that a 10% increase in the Air Pollution Index (API) was associated with a 0.3% drop in calls handled each day. Translated to China’s office workers as a whole, a 10% improvement in air pollution equates to $2.2 Billion/year in productivity. Or, to put it in a big city North American context (Los Angeles), were the 90 days that pollution levels exceeded EPA standards eliminated, the productivity for that city alone would be $378 greater. As the authors comment in terms of broader implications, pollution restrictions, aimed at an improved environment, are sometimes seen as a negative, unfair “tax” by businesses. This paper shows that it could help rather than hinder their bottom line.

 pollution-productivity  

Key Quotes:

“this is the first study to demonstrate that the negative impacts of pollution on productivity extend beyond physically demanding tasks to indoor, white-collar work.”

 “the number of calls workers handled each day went down as the air pollution index (API), which is driven by particulate matter pollution in this setting, increased (see Figure 1). On average, a 10% increase in API was associated with a 0.3% drop in the number of calls handled each day. Given the range of pollution in our setting, this result suggests that workers are 6% more productive on low-pollution days than high-pollution days.”

“even a modest 10-unit reduction in national API levels would increase the monetised value of office worker productivity in China by $2.2 billion per year.”

“when the API exceeds the US Environmental Protection Agency standard of 100… In 2014, Los Angeles experienced 90 such days.. our results imply that the service-sector productivity in Los Angeles would have been $374 million larger had pollution levels met regulatory standards on those days." 


“we tested whether pollution led to workers staying home or showing up to work late. That did not appear to be the case – on heavily polluted days, we saw fewer calls but similar hours worked.”

“It also helps to recast political discussions of environmental regulation as simply a tax on the business community – instead, reducing pollution may improve the financial bottom line.”

Tuesday, August 23, 2016

What is the Impact of Air Pollution on the World- Present and Future?


Also discussed here: Air pollution to cause 6-9 million premature deaths and cost 1% GDP by 2060 (OECD Press Release, Jun. 9. 2016) 

Today we review a report from the OECD which estimates the impact of air pollution in terms of economic costs and on health costs and premature lives lost. Global costs are expected to rise from $21B in 2015 to $176B in 2060 (in constant 2010 dollars). The number of lost sick days which affects productivity is expected to rise from 1.2 B to 3.7 B in 2060. The number of premature deaths due to outdoor air pollution is expected to rise from 3 million in 2015 to 6-9 million in 2060. Policies to address this include incentives aimed at technology to reduce vehicle emissions, the implementation of improved air quality standards and introduction of emission/congestion/road pricing. The highest per capita costs are found in China, followed by Korea, Eastern Europe and the Caspian region and this is also where premature deaths per capita are highest

oecd impacts
Key Quote

The most recent Global Burden of Disease (GBD) study estimates that air pollution – indoor and outdoor combined – was the cause of 5.5 million premature deaths globally in 2013

 The number of lives cut short by air pollution is already terrible and the potential rise in the next few decades is terrifying. If this is not motivation enough to act, this report shows there will also be a heavy economic cost to not taking action

The projected increase in concentrations of PM2.5 and ozone will in turn lead to substantial effects on the economy. According to the calculations in this report, global air pollution-related healthcare costs are projected to increase from USD 21 billion (using constant 2010 USD and PPP exchange rates) in 2015 to USD 176 billion 2005 in 2060. By 2060, the annual number of lost working days, which affect labour productivity, are projected to reach 3.7 billion (currently around 1.2 billion) at the global level. 

This report projects an increase in the number of premature deaths due to outdoor air pollution from approximately 3 million people in 2010, in line with the latest Global Burden of Disease estimates, to 6‑9 million annually in 2060

the implementation of policies, such as incentivising the adoption of end-of-pipe technologies, implementing air quality standards and emission pricing, will certainly help avoid the worst impacts of outdoor air pollution

“Premature death rates are forecast to be up to three times higher in 2060 than in 2010 in China and up to four times higher in India. Death rates are seen stabilising in the United States and falling in much of Western Europe thanks in part to efforts to move to cleaner energy and transport

 The regions with the highest per capita costs are China, followed by Korea, Eastern Europe and the Caspian region. These are regions in which the number of cases of illness per capita is highest

Thursday, July 14, 2016

What Links Urban Metabolic Energy Flows and Urban Ecosystems – a literature review.

Eight energy and material flow characteristics of urban ecosystems (12 page pdf, Xuemei Bai, Ambio, Apr. 22, 2016)

Today we examine a review of current literature about two apparently conflicting urban concepts: one that is concerned with the material energy flows, the other with the ecology of wildlife and plants in a city environment. As cities become more complex and larger these concepts become more important in themselves, as well as between each other with intercity distributions and the regulation of processes across large urban areas and estimating the capacity of a city when to comes to the flow of materials, such as waste Approaching cities in this way also allows for a better defined environmental footprint, as demonstrated in one example in Barcelona, where a park designed for carbon sequestration was found after analysis to be one twelve the size needed to produce the desired absorption of carbon emissions from the city. The concluding words are worth noting: “A better understanding of the interactions between anthropogenic material and energy flows and ecosystem processes can help reduce unintended consequences of narrowly focused policy and management decisions.”

 urban metabolism  

Key Quotes :

 « The concept of urban metabolism has been widely used to study energy and material flows into and out of cities… recent urban energy and material flow studies have extended far beyond the original metaphor of cities as organism, and started to reveal important characteristics of urban system features and interactions.. Urban energy and material flow efficiency can be defined as how much social/economic services per unit of resource consumption or waste generation can support. It shows how efficient the urban system is in supporting its function, and is an important system performance indicator.”

“The input part of the urban metabolism includes various tangible materials such as food, water, construction and other materials, products, energy, as well as inflow of energy, capital, information, and people. Such input supports societal activities and drives urban functions within a city; forms urban stocks such as housing, building, infrastructure, and green parks; and produces products and services, as well as managed and unmanaged waste and emissions.”

“The output part consists of industrial products, services, knowledge, and various wastes and emissions. The magnitude, distribution, and internal interactions and feedbacks are regulated by policy, governance, culture, and individual and collective behaviour of the urban system.”

 “Understanding biogeochemical budgets of ecosystems, in particular nutrients such as carbon, nitrogen, and phosphorus, has been one of the crucial elements of urban ecology” “The metabolic budget can be used to assess the total ecological footprints of cities”

 “The total budget and pathways of material and energy flows reveal the magnitude of impacts and other important characteristics of urban system, such as the functional role of the city, development stages (i.e., mature or growing city), level of infrastructure and development, income, and other socioeconomic characteristics of the city”

Thursday, June 16, 2016

Limits to Growth – a critique after 40 years

Limits Revisited - A review of the limits to growth debate (24 page pdf, Tim Jackson and Robin Webster, Apr., 2016)

Today we review a report card on the 1972 Club of Rome report that looked ahead in 12 scenarios for the century ahead to examine the links between and among population, the economy, consumption of resources and pollution of the land, water and air. The indication that oil production would peak in 2015 if no corrective action were taken is strikingly accurate, given the shift now taking place in renewable energy production. On the other hand the report did not take into account the following ecological processes in regulating the environment: climate change, ocean acidification, biodiversity loss, interference with global nitrogen and phosphorous cycles, ozone depletion, global freshwater use, land system change, atmospheric aerosol loading and chemical pollution. Of these, four have deteriorated into an uncertain future: biodiversity loss, damage to phosphorous and nitrogen cycles, climate change and land use.

Although there are hopeful signs that economic growth may be decoupling from the environment with respect to reduced carbon emissions though technological innovations, the social burden continues to get worse with more than 3 billion people trying to live on less than $2 per day, as underlined by the encyclical by Pope Francis. An uncontrolled collapse is still possible, not from consuming all remaining natural resources but because of the degraded quality of those resources. As the report concludes: “an early policy response matters”.

 graph limits  

Key Quotes:

 “Limits Revisited outlines the contents of the Club of Rome’s report, traces the history of responses to it and dispels some of the myths surrounding it.”

 “The 1972 report articulated for the first time the dynamic nature of our dependency on physical resources and on ecological systems. It illustrated the processes of ‘overshoot and collapse’ that can occur when these limits are approached and suggested that, without a shift in direction, adverse consequences would become obvious “within the next century””

“The MIT team presented and analysed 12 scenarios, each with a different pattern of world development from 1900 to 2100…Only four scenarios avoided overshoot and collapse. These scenarios combined stabilising the human population with measures to restrict industrial output per person, as well as technological solutions like resource recycling and pollution control… One scenario which didn’t introduce these measures until 2000 managed to reached equilibrium, but not permanently…The diversion of more and more capital to extracting them [natural resources] leaves less for investment in industry, leading to industrial decline starting in about 2015. Around 2030, the world population peaks and begins to decrease as the death rate is driven upwards by lack of food and health services.”

 “A 2015 analysis of the remaining fossil fuel resources in China, USA, Canada and Australia, which includes unconventional resources, suggests that overall oil production is in fact peaking already… World fossil fuel production is likely to peak in around 2025, it suggests, largely as a result of Chinese coal production peaking. In short, unconventional oil seems to buy us several more decades before resource depletion starts to bite.”

“For each process, the team identified a ‘zone of uncertainty’ and a ‘danger zone’. Crossing over these thresholds could mean “non-linear, possibly abrupt and irreversible earth system responses” with disastrous consequences for society.. in 2015 found that four of these planetary boundaries had already been crossed. Biodiversity loss, damage to phosphorous and nitrogen cycles, climate change and land use have all slid into or beyond the ‘uncertainty zone’.”

“»In the last two years, carbon emissions from burning fossil fuels and industry flattened and even fell slightly, while GDP increased by 3.4% and 3.1% respectively.… it’s essential to distinguish between what’s called relative decoupling – a decline in the material intensity of economic output – and absolute decoupling – an absolute fall in material use or emissions. Much of what is celebrated as decoupling is relative rather than absolute decoupling.”

 “key issues:
  • the economic implications of declining resource quality;
  • the financial market implications of low-carbon investment strategies;
  • the political implications of the need for precautionary, longterm thinking;
  • the social implications of inequality in the distribution of available resources;
  • the macroeconomic implications of secular stagnation or degrowth.”