Showing posts with label quality of life. Show all posts

Monday, September 26, 2016

Which Countries Have the the Most and Least Sustainable Cities?

A Global Perspective on the Sustainable Performance of Urbanization (16 page pdf, Liyin Shen, Chenyang Shuai, Liudan Jiao, Yongtao Tan and Xiangnan Song, Sustainability, Aug. 11, 2016)

Today we review a comparison of 111 countries, according to how well they perform in urban sustainability, made up of indices of environmental, economic and social sustainability. The best overall performers are developed countries in Western Europe, the worst in Africa and Asia. It is notable that although Sweden is not the top performer in any one of the three indices, it is the best overall, signaling how well that country balances the three aspects.

  urban-sust  

Key Quotes:  

" Urbanization has been identified as one of the most important strategies for development in the 21st century… According to the World Bank, ..the ratio of urban populations at a global level has already exceeded 50% in 2007 and this will continue to rise in the coming decades”

 “Sustainable urbanization can be defined as “urbanization practice that complies with sustainable development principles that combines environmental, social, and economic sustainability”

“the selected countries are ranked according to their overall performance in implementing sustainable urbanization, with the top five performers being Sweden, Norway, Germany, the Netherlands, and Demark, and the five worst countries being Mozambique, Nigeria, Togo, Yemen, and the Democratic Republic of the Congo.”

“in the environmental dimension, the top five performers are Norway, Sweden, Romania, Denmark, and Germany, and the worst five are Nigeria, Tajikistan, Saudi Arabia, India, and Syria.” “when the economic dimension is considered, Luxembourg, the Netherlands, Sweden, Switzerland, and Norway are the best five, and the Democratic Republic of the Congo, Mozambique, Yemen Namibia, and Tajikistan are the five poorest.”

“from the perspective of social sustainability, Singapore, Germany, Switzerland, Sweden, and Japan are the best five, while the Democratic Republic of the Congo, Cote d’Ivoire, Angola, Togo, and Mozambique are the worst five”

“the best performers in terms of overall sustainable urbanization during the surveyed period are Sweden, Norway, Germany, the Netherlands, and Denmark. The best performers are mainly developed countries in Europe. Other good performers include Brazil, Romania, and Thailand. Poor performers are mainly distributed in Africa and Asia.”

 “there is a negative correlation between urbanization rate and sustainable performance when urbanization is at the initial stage, and a positive correlation when urbanization is at the acceleration stage.”

Tuesday, March 8, 2016

What is the Social Cost of Carbon Pollution?

How do we define climate pollution's cost to society? (Elizabeth Shogren, DC Dispatch Jan. 27, 2016)

Also discussed here: Evidence on the Impact of Sustained Exposure to Air Pollution on Life Expectancy from China’s Huai River Policy (53 page pdg, , Yuyu Chen, Avraham Ebenstein, Michael Greenstone and Hongbin Li, Massachusetts Institute of Technology, Department of Economics, Working Paper Series, Jun.20, 2013)

And here: Americans Are Living Longer, Thanks to the Clean Air Act (Melissa C. Lott, Scientific American, Jan. 31, 2016

Today we review a paper by an Interagency Working Group on the Social Cost of Carbon (United States Government) which estimated the economic benefit of carbon pollution reductions, taking into account future discount rates and, using a model, the atmospheric impact of a metric ton of carbon, and how it affects earth temperatures in terms of a range of impacts such stresses to agriculture and increased need for air conditioning etc. Estimated costs to 2050 range from $11 (at a predicted 5% average rate) to $221(at 3% rate) per metric ton of CO2. The opposite side of this issue is the cost of imposing a government policy which results in damages to the public,

One example of air pollution policy yielding benefits is the Clean Air Act in the USA which has produced 336 million life-years since 1970. Another example from Northern China (with a 500M population, greater than the entire USA) where an earlier policy (which was reversed in 2007) to burn coal to support industry resulted in health impacts and a loss of 2.5 million life years of life expectancy for the region- or 5.5 years per person. The need to consider this direct cost and benefit, as well as the incentive value of carbon pricing to encourage renewable energy use, is obvious. social cost poll

 Key Quotes:

“The value of carbon emissions reduction is certainly not zero.. if the cost of polluting is not zero, what it is? Fletcher’s ruling challenged government officials to come up with a dollar amount that represents how much a ton of carbon pollution will “cost” society over the long run. Economists refer to this as the social cost of carbon. “

“climate change affects many aspects of society, including public health, environment, agriculture, natural disasters and economies…The damages from the concentration of greenhouse gases in the atmosphere — everything from heat waves to sea level rise — are felt across the globe.”

“First, the models estimate how a metric ton of carbon pollution will impact concentrations of greenhouse gases in the atmosphere. Second, the models estimate how those concentrations will affect temperature on Earth. Third, they analyze how increases in temperature will translate into a range of impacts”

“the Environmental Protection Agency’s analysis of its Clean Power Plan cites benefits in carbon dioxide reductions in 2030 that range from $6 billion to $60 billion”

“The population in Northern China between 1990 and 2000 exceeded 500 million. ..an arbitrary Chinese policy that greatly increases total suspended particulates (TSP) air pollution is causing the 500 million residents of Northern China to lose more than 2.5 billion life years of life expectancy.. life expectancies are about 5.5 (95% CI: 0.8, 10.2) years lower in the North due to an increased incidence of cardiorespiratory mortality.”

“Americans have gained 336 million life-years since the Clean Air Act was passed in 1970”

Tuesday, June 16, 2015

How Does Exposure to Fine Particulate Matter Cause Anxiety in Older Women?

High Anxiety
High Anxiety (Photo credit: Wikipedia)
The relation between past exposure to fine particulate air pollution and prevalent anxiety: observational cohort study (9 page pdf, Melinda C Power, Marianthi-Anna Kioumourtzoglou, Jaime E Hart, Olivia I Okereke, Francine Laden, Marc G Weisskopf, British Medical Journal, Mar. 24, 2015) 

Also discussed here: Air pollution may be related to anxiety levels in women: study (Kathryn Doyle, Toronto Globe and Mail, Apr. 1, 2015) 


Today we review research into the impact of exposure to PM2.5 had on anxiety for a large group of older women (mean age 70) over various periods of exposure. Anxiety disorders affect 16% of people worldwide over their lives and 11% have suffered from it in the last year. Results indicate a clear link with 12% more of those exposed to fine particulates showing high anxiety symptoms than those who were not so exposed. Also those who live between 50 and 200 m of busy roadways with traffic-related air pollution were more likely to show these symptoms than those who live farther away. Exposure to larger sized particulates (such as PM10) and exposure within 50 m of roadways did not show greater anxiety symptoms. Because of the people sampled in this study, it is not possible to extend these results to younger women or to men although there is evidence of pollution-stress links for the latter group.


Key Quotes: 

“Globally, approximately 16% of people will have an anxiety disorder in their lifetime and 11% will have experienced an anxiety disorder in the past year…In 2010, anxiety disorders accounted for approximately 26.8 million disability adjusted life years worldwide”

“Women have a higher prevalence of anxiety disorders than men and the onset for most anxiety disorders is commonly in adolescence or young adulthood.” 

 “Among the nurses who responded to the questionnaire, 15% experienced high levels of the following symptoms:
  • Fearfulness
  • Desire for avoidance
  • Tendency to worry.”
“women who were exposed to the most small particles in the air one month before their anxiety test were about 12 per cent more likely to have high anxiety symptoms than those not exposed to these particles one month previously.”

"Nurses who lived 50 to 200 m from the nearest major road were more likely to have increased Crown-Crisp index phobic anxiety scale scores than those living >200 m away”

“Our data support an association between exposure to particulate matter of <2.5 μm in diameter (PM2.5) but not 2.5 to 10 μm in diameter (PM2.5–10) or proximity to roadways, and high symptoms of anxiety. The association between PM2.5 and high anxiety seems primarily driven by a relation with shorter term average exposures to PM2.5”

“it is possible that reductions in exposure to PM2.5, through changes to regulations or individual behavior, may help reduce anxiety symptoms”

"Since air pollution causes systemic inflammation, it is reasonable that researchers have now turned to the arena of mental health, a leading priority for research given the relative absence of known modifiable risk factors and a high and growing disease burden,"

Thursday, May 28, 2015

Why is Vancouver the Greenest City in the world and How is it Planning to Be Better?

Eleven Reasons to Support Vancouver’s Transportation Tax (11 page pdf, Todd Litman, Victoria Transport Policy Institute, Mar. 19, 2015)

Also discussed here: The case for the mayors’ transit plan -- 10 reasons to vote Yes - For one thing, the tax increase of about $200 per household would finance savings of $1,000 (Don Cayo, Vancouver Sun, Mar.31, 2015)

  transit ridership    

Key Quotes:  

“automobile travel is peaking in B.C., while increasingly popular walking and cycling options now represent 10 to 15 per cent of all trips.”

Some benefits from walking, cycling and taking transit:
  • Saves households money - The proposed tax increase would cost average households about $200 annually but provides over $1,000….Vancouver region has the lowest portion of household expenditures devoted to transportation among Canadian cities
  • Increases safety - The Lower Mainland’s traffic fatality rate (3.9 deaths per 100,000 residents) is among the lowest of all North American cities.
  • Congestion reductions -High quality, grade-separated transit service reduces traffic congestion
  • Reduces parking problems and costs -Parking costs range from $5,000 per space for surface parking up to $50,000 for structured or underground parking.
  • Improves mobility for non-drivers - In a typical community, 20-40% of residents cannot or should not drive. High quality public transit helps non-drivers access school and jobs, increasing their productivity,
  • Reduces chauffeuring burdens- Many drivers spend several hours per week chauffeuring non-drivers for trips that they could make independently if better transportation options were available.
  • Improves public health.
  • Supports Economic Development
  • Energy conservation and pollution emission reductions - Residents of transit-oriented communities consume 20-60% less energy, and reduce their pollution emissions by similar amounts
  • Supports strategic development objectives (reduces sprawl)
  • Prepares Vancouver for your future.
“Public transit service often seems costly, in part, because of the way we account for transportation facilities and services. Public transit budgets include all costs: right-of-way (rail tracks), terminals (stations), vehicles, fuel and drivers. In contrast, automobile travel requires roads, parking spaces at each destination, vehicles, fuel and drivers, the costs of which are seldom totaled. As a result, public transit costs per passenger-mile often seem higher than the costs of building and maintaining roads, but this ignores the costs to consumers of owning and operating their vehicles, and the costs to consumers, businesses and governments of providing abundant parking”

“using standard transportation system performance indicators, including automobile mode share (low and declining), per capita transit ridership (high and growing), and per capita traffic fatalities (among the lowest among North American cities) and portion of household budgets devoted to transportation (the lowest of all major Canadian cities), Vancouver performs very well compared with peer cities”

Friday, June 27, 2014

How Can We Find the Most Environmentally Sustainable Place in the World?

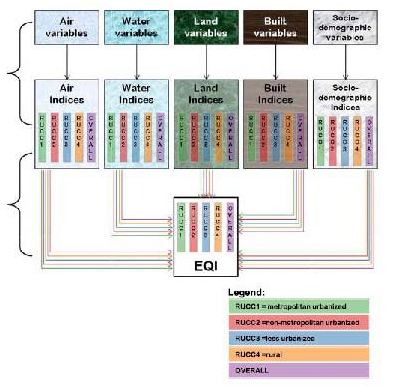
Construction of an environmental quality index for public health research (39 page pdf, Lynne C Messer, Jyotsna S Jagai, Kristen M Rappazzo, Danelle T Lobdell, Environmental Health, May 22, 2014) Today we review research aimed at developing a more accurate index of environmental quality than traditional indices used to select the greenest or healthiest or highest environmental quality of a place in the world. The older indices tend to use spot observations of a single indicator to represent an area or ambient value, and they tend not to consider a combination of several variables to evaluate land, air, water, built environment and socio-demographic conditions. An example of the latter is the difference in crime rates between urban and rural areas where the latter would feel safer and have a higher environmental quality than the former, all other variables constant. On the other hand, some urban areas have a better built environment (more bike and pedestrian paths, etc) than some rural areas where highway deaths are higher.

The proposed Environmental Quality Index (or EQI) uses 22 performance indicators to estimate environmental sustainability for all the counties in the USA. The resulting indices were weighted so that there were an equal number of regions at the low end as well as at the high end of the index scale. As the authors note, the EQI represents only the outdoor environment and indoor conditions may, on occasion, be more important from a health point of view or need to estimated from a different set of variables.

 env index 

Key Quotes:

“The empirical characterization of environmental conditions, however, is challenging because the non-residential ambient environment comprises an almost uncountable array of complex mixtures, which are difficult to quantify simultaneously… rarely, if ever, are multiple environmental domains combined, even though we know humans are exposed to these multiple environmental domains simultaneously”

“Here we describe a method of constructing an environmental quality index (EQI) representing multiple domains of the non-residential ambient environment, including the air, water, land, built and sociodemographic domains.”

“We developed an Environmental Quality Index for all counties in the United States incorporating data for five environmental domains: air, water, land, built, and sociodemographic. For each environmental domain, variables were constructed to represent exposures within that domain; indices for each domain and for environmental quality as a whole were developed by stratifying by rural–urban continuum codes. Variable loadings varied by domain and rural–urban designation, suggesting that environmental quality is driven by different domains in rural and urban areas.”

“The EQI is focused mostly on the outside environment, which may not be the most relevant exposure in relation to human health and disease.”

Wednesday, May 28, 2014

What is the Impact of Air Pollution on IQ and Lifetime Earnings?

Prenatal exposure to airborne polycyclic aromatic hydrocarbons and IQ: Estimated benefit of pollution reduction (Abstract, Frederica Perera, Katherine Weiland, Matthew Neidell and Shuang Wang, Journal of Public Health Policy, May8, 2014)

Also discussed here: Improving air quality in NYC would boost children's future earnings by increasing IQ (ScienceDaily, May 8 2014)

Today we review research into the link between a pollutant associated with the burning of fossil fuels in an urban environment (polycyclic aromatic hydrocarbons or PAH) and the impact on a child’s IQ, and further, how a lower or higher IQ affects lifetime earnings by that child. The impact of air pollution on aging and seniors has been studied as has the impact on pregnant women and the health of their babies but this is the first we have seen to make the link to IQ and lifetime earnings. Results indicate that a 25% decrease in PAH translates to an increase of $215 earnings for the population of New York City.
 

NYC pollution  

Key Quotes:

“The developing fetus and young child are especially vulnerable to neurotoxicants, such as polycyclic aromatic hydrocarbons (PAH) released to ambient air by combustion of fossil fuel and other organic material”

"Our analysis suggests that a modest reduction in urban air pollution would provide substantial economic benefits and help children realize their full potential…The researchers made their calculation using a hypothesized modest reduction of .25 nanograms per cubic meter air (ng/m3) of ambient concentrations of polycyclic aromatic hydrocarbon (PAH), a family of chemicals created by burning fossil fuels that is ubiquitous in urban air"

“Gains in IQ related to the hypothetical 25% reduction in PAH translated to increased lifetime earnings of $215 million.”
Enhanced by Zemanta

Wednesday, April 23, 2014

How Depressing is Traffic-Related Air Pollution for the Elderly?

Dragging the weight of the old age
Dragging the weight of the old age (Photo credit: Giulio Magnifico)
Ambient Air Pollution and Depressive Symptoms in Older Adults: Results from the MOBILIZE Boston Study(26 page pdf, Yi Wang, Melissa N. Eliot, Petros Koutrakis, Alexandros Gryparis, Joel D. Schwartz, Brent A. Coull, Murray A. Mittleman, William P. Milberg, Lewis A. Lipsitz, and Gregory A. Wellenius, Environmental Heralth Perspectives, Mar. 7, 2014) 

Today we review a study that had surprising results for older people in reasonably good health who live near traffic and air pollution in a large American city (Boston). Despite much environmental health research that this exposure causes neurological and cardiovascular diseases, there was no evidence from this study that air pollution on a short or long term bases causes depression. By contrast, it is worth noting that those most likely to suffer depression and living near traffic were younger females. 


 Key Quotes: 

“air pollution can cause systemic inflammation, neuroinflammation, oxidative stress, cerebrovascular damage, and neurodegenerative pathology…. and inflammation and vascular disease contribute to the risk of, or exacerbate, specific types of depression” 

“fluctuations in ambient levels of particles with aerodynamic diameter less than 10 μm (PM10), nitrogen dioxide, and ozone have been associated with more severe depressive symptoms among older adult participants…and a higher rate of emergency department visits for depression and attempted suicide” 

“participants living 100-250 m from a major roadway had the lowest mean age, were most likely to be female, were the least likely to be non-Hispanic white and have diabetes or hypertension, and were most likely to report use of antidepressant medication” 

 “we found no evidence suggestive of a positive association between the presence of depressive symptoms and markers of long-term exposure to traffic pollution. In addition, short-term changes in levels of ambient air pollutants were also not associated with the presence of depressive symptoms. ”
Enhanced by Zemanta

Friday, February 14, 2014

How do they Measure Resilience to Climate Change Disasters?

Reduction of flood and associated extreme weat...
Measuring psychological resilience to disasters: are evidence-based indicators - an achievable goal? (20 page pdf, Jose Manuel Rodriguez-Llanes, Femke Vos, Debarati Guha-Sapir, Environmental Health , Dec. 20, 2013) 

Today we review the ways that resilience can be measured and in particular, psychological resilience, based on a literature review of this factor in various scenarios and disasters. Unlike many climate impact studies this research looks at human behavior and how humans react to events that present challenges. Results indicate not surprisingly that social support increased resilience, in general, while women showed a larger risk of lower psychological resilience following a disaster. These findings would be important in disaster planning especially with the higher risk of larger and larger disasters expected with the greater variability of wind, temperature and precipitation extremes from climate change.

Key Quotes : 

Resilience[IPCC]: “the ability of a system and its component parts to anticipate, absorb, accommodate, or recover from the effects of a hazardous event in a timely and efficient manner, including through ensuring the preservation, restoration, or improvement of its essential basic structures and functions”

 “Fifty three indicators of psychological resilience were obtained from the six empirical studies that focus exclusively on disaster settings (Table 2). The most consistent indicators of psychological resilience were social support and gender.” 

“Whereas high levels of social support from relatives and friends increased all studied resilient outcomes, women were found at higher risk of suffering a worse psychological resilient outcome after a disaster.” 

“evidence-based indicators should be preferable by policy makers to establish a list of priorities for data collection or targeted groups for intervention before and after disasters … should be a much more valid approach than following a strategy simply based on data availability”
Enhanced by Zemanta