Showing posts with label pricing. Show all posts

Thursday, March 2, 2017

What are the Health Benefits of Congestion Pricing?

Congestion Pricing, Air Pollution, and Urban Health (11 page pdf, Emilia Simeonova, Janet Currie, Peter Nilsson and Reed Walker, American Economics Association Meeting, Chicago, Jan. 2017)

Also discussed here: Driving Fee Rolls Back Asthma Attacks in Stockholm (Nala Rogers, Inside Science. Feb. 2, 2017)

Today we review research on the impact of the introduction of congestion pricing in Stockholm, in 2006, and the reduction of traffic that followed on the health of children in that city. Pollution levels in that city are lower than EPA’s standards. Results indicate that the pricing system caused a drop in traffic volumes by 25%, reductions in NO2 and particulate (PM10) pollution of 5 and 10% and a reduction in asthma cases by 12% in the first seven months which increased to 45% over the longer term (several years). While the benefits in other cities with fewer diesel vehicles (emitting PM) may not be as great, it is clear that there are benefits even when the air quality in a given city (such as Ottawa) is considered “good” and that there are negative health impacts that begin at lower thresholds than EPA standards project.


stockholm-congestion-health  

Key Quotes:

"We are already looking at an area that has much lower levels [of pollution] than the current [U.S. Environmental Protection Agency] standards, and we are reducing those levels by a little bit…Yet we see these vast changes in the health status of children."

“The tax varies between 0 and 2.6 USD per vehicle, depending on the time of the day. There are no charges at night, on weekends and public holidays, or during July. The toll is automatically collected using license plate scanning technology as cars cross the perimeter of the congestion zone.”

"If you're just looking at the short-term effects of lower levels of pollution, you will probably be missing a big piece of the picture."

 “current standards for air pollution may not adequately protect children…there is mounting evidence that health shocks in infancy and childhood have long-lasting impacts on affected children …the mechanisms through which children are affected by traffic-generated pollution may differ from those in adults. Lung development continues post-natally until the adolescent years and is susceptible to negative environmental shocks”

“Children under the age of six are the most likely to experience acute asthma. For example, U.S. children 0 to 4 are 1.9 times more likely to have an asthma attack than children 12 to 17 “

“Our estimates show that permanent reductions in air pollution from automobiles, even in locations which have average pollution levels well below the current EPA standards, can have significant positive effects on children’s respiratory health. “

“Congestion pricing may not work the same way in every part of the world. For example, diesel vehicles are more popular in Sweden than in the U.S.. Diesel produces more nitrogen dioxide and particulates than gasoline, so Sweden may have more to gain from small reductions in driving.”

Tuesday, February 14, 2017

How Will We Get Around Town in 30 years and What Obstacles Need to be Overcome?

What will the local transport system look like in 2045? The future local transport system (David Levinson, Transportist, Dec.19, 2016)

 Also discussed here: What key factors do you see driving these changes over the next 30 years? (David Levinson, Transportist, Dec.19, 2016)

And here: Future Demand - New Zealand transport and society: Scenarios to 2042 (23 page pdf, New Zealand Government, Nov. 2014)

Today we review an interview on the future local transportation with Marcus Enoch by David Levinson and a report looking ahead to 2042 as part of New Zealand project PT2045. Enoch sees the automation of vehicles, their conversion to electric and the rise of shared mobility, as opposed to owning a vehicle, as the three most important changes. There will be a lot more single passenger, two wheeled e-cars and goods will be delivered by robot cars. Manually driven cars on public roads will be prohibited in 25 years. Urban congestion will end before 2042 with fewer, if any, private vehicles on the road. Carbon emissions will fall dramatically.

 nz-scenarios-for-2042  

Key Quotes:

“the most important change, will be the automation of vehicles – both private and public transport vehicles.” “The second most important change is the conversion of the vehicle fleet to being primarily electric.”

“The third change .. is the rise of shared mobility, mobility-as-a-service, where people won’t be owning cars, but instead will subscribe to a service, or buy the services on demand.”

“there will be a lot of single passenger vehicles. The best example I have is the Toyota iRoad vehicle, which is basically an enclosed motorcycle that’s safe and stabilised and, will, well before 2045, be automated. And it is safe because, not only is the vehicle designed well, with a roll bar and all that, but because all the other vehicles are also automated.”

 “there will be a substitution of logistic services for a lot of shopping trips, and we need to think about that. In urban areas the best model I have seen was a demo of using a small robot for delivering goods from stores to people’s homes”

“the political system is going to have to play catch up with the technological system, and legal system is also going to be playing catch up. ..Uber decided what service they were going to provide, and they did it illegally, and they got away with it” “From an economic perspective, at the point where it’s cheaper to provide an automated vehicle than it is to provide a manually driven vehicle, people will switch over.”

 “25 year timeframe is probably enough for the last manually driven car to be prohibited from driving on streets or public roads most of the time.”

 “Congestion is a thing of the past. Compared to 2014, fewer people can afford to travel across and between towns by private vehicle so many urban and regional roads are relatively free of private travellers. Inter-regional bus services have increased in popularity, connecting market towns to urban centres.”

“Compared to 2014, people are using all motorised forms of transport far less. People prefer exploring the digital world to travelling outside. Obesity and diabetes rates have increased because of a lack of physical exercise. People regularly try to manage their health by walking and cycling for recreation. Climate emissions from transport have fallen dramatically.”

Thursday, February 9, 2017

How Would Vancouver Transition to a Driverless City?

Turning Transportation Challenges and Opportunities Presented to the City of Vancouver by Autonomous Vehicles (93 page pdf, Cail Smith, Greenest City Scholars Report, Aug. 31, 2016)

Also discussed here: Vancouver Prepares For a Driverless Future That Includes Extra Space for Walking, Cycling, and Transit (Mobility, Jan. 17, 2017)

And here: Transportation 2040 Plan: A transportation vision for the City of Vancouver (City of Vancouver)

And here: Transportation 2040 (99 page pdf, Plan as adopted by Vancouver City Council, Oct.31, 2012)

Today we review plans and reports aimed at the future of Vancouver in 2040 which may include a transition to driverless or autonomous vehicles (AV) as well as meeting the target of having 2/3 of all trips made on foot, by bike or transit. With a 90% AV share, freeway congestion would be reduced by 60% from present levels and 30% of city traffic would be reduced by no need to search for parking. Garages could be converted to guest houses and garage lanes to useful parks or gardens. Shifting to AVs would save the average Canadian household $2,700 per year (4% of income) by decreasing insurance, fuel and parking costs, as well as saving the City of Vancouver $15 M/yr on maintaining and monitoring parking spots, while also reducing revenue from parking tickets by $53M/yr (also 4% of net revenue).

 driverless-vancouver  

Key Quotes:

 “We need to ensure we are proactive in meeting our Transportation 2040 goals, and whether there are policies in the City’s toolkit to help minimize the risks and pressures automated vehicles might put on those goals.”

“Transportation 2040 plan – passed unanimously by Council in October 2012 – is a key policy direction that explicitly prohibits a net increase in motor vehicle capacity on City of Vancouver streets. Once driverless dreams become a reality, this creates an exciting opportunity for building complete streets that include wider sidewalks, protected bike lanes, and bus rapid transit lines.”

“In the next 30 years, the number of Vancouver residents aged 60 and over will more than double. An aging population means changes in travel patterns and more people with physical challenges getting around our city”

 “In the City of Vancouver, vehicles account for over 30% of greenhouse gas emissions. We can make a big difference by prioritizing sustainable transportation choices that use renewable fuels or use fuels more efficiently (transit, ride-sharing, and low-carbon vehicles), or don’t use fuel at all (walking, cycling)”

 Some key targets:

“By 2040, at least two-thirds of all trips will be made on foot, bike, or transit. The total number of trips by sustainable modes will grow significantly, while motor vehicle volumes will slightly decline.”

 “By 2020, the average distance driven per resident is reduced by 20% (from 2007 levels)”

“Although the Telsa Model S and Google Car are both well - known as “driverless” vehicles, they have very different capabilities. The Model S is only at level 3 so when its ADAS systems are engaged, the driver must still be ready to intervene at anytime. On the other hand, the Google Car is closer to level 4 or 5 and the driver is not expected to monitor the vehicle.”

 “Industry experts suggests that by 2040, AVs will be the primary means of transport” “I was able to convert the garage in a laneway house for my mother-in-law. Our whole neighbourhood is doing something similar. Our back lane is a great public space.”

“There also might be significant changes to or the removal of traffic signals, traffic markings and signage designed to communicate with users piloting motor vehicles. Research is already being done on autonomous intersection management (AIM) where an intersection “server” Communicates directly with vehicles rather than through traffic lights”

“If AVs are able to reduce the space between vehicles in a lane,.. that with 90% AV market share, freeway congestion would be reduced to 60% of its current levels. Additionally, if AVs can drive in narrower lanes, road space can be reallocated for walking, cycling and transit paths.”

“The time and VKT spent searching for parking also has a significant impact on congestion in the city; some researchers estimate 30% of city traffic can be attributed to people searching for parking “

“Fewer parking spots will also reduce maintenance and monitoring costs (a $15,153,000 expense for the City in 2015) and also reduce the revenue generated from parking ($53,178,000 revenue in 2015, around 4% of total revenue).

“In Canada, the average private vehicle sits idle for over 23 hours per day and costs over $9,000 annually if driven regularly …Initial research indicates that switching to SAVs could save individual households an average of $2,700 per year (4% of the average household budget) by decreasing insurance, fuel and parking costs “

Thursday, December 1, 2016

How do Travel Demand and Economics Affect the Development of Urban Road Networks?

A Model of the Rise and Fall of Roads (33 page pdf, Zhang, Lei, Levinson, David M, Systems Symposium at the Massachusetts Institute of Technology, Mar. 2004)

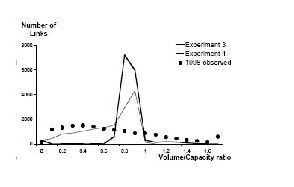
Today we review a seminal paper from over a decade ago that examines the dynamics of road development in a major mid-West American city (Minneapolis-Saint Paul) using a model that combines measures such as travel demand statistics (usually found on Origin Destination studies) with the economics of road pricing or tolls, geographical constraints (such as rivers and mountains) and how these change with newer technology over time (in this case over 20 years). Roads represent both figuratively and physically the link that join the issues addressed in this blog: how traffic is linked to pollution and how pollution is linked to health. Of particular interest is the way that travel demand and road volume capacity (VC) interact with road tolls and the cost of road construction and the resulting revenue that may be used to ease congestion, in addition to the overall design of the road network and design for a major urban area. road-links  

Key Quotes:

 “In 1900 there were 240 km of paved road in the United States … and this total had increased to 6,400,000 by 2000 …with virtually 100% of the U.S. population having almost immediate access to paved roadways.”

“questions yet to be answered: (1) How do the existing links (roads) develop and degenerate? (2) How are new links added to the existing network? (3) How are new nodes added to the existing network?” “the Twin Cities transportation network which comprises nearly 8,000 nodes and more than 20,000 links, using network data collected since year 1978”

Specific questions on the rise and falls of roads:
  1. “Why do links expand and contract?
  2. Do networks self-organize into hierarchies?
  3. Are roads (routes) an emergent property of networks?
  4. What are the parameters to be calibrated in a microscopic network dynamics model?
  5. Is the model computationally feasible on a realistic transportation network?
  6. Is the model capable of replicating real-world network dynamics?”
“economic growth is a two-way interaction between the economy and technology; technological research transforms the economy that finances it.. transportation investment drives the growth that funds it.” “In developed countries where transportation infrastructure has reached its saturated stage, it is rare to see new network growth from a tabula rasa. Even in an empty place without any previous developments, natural barriers such as rivers and mountains still impose constraints on future network growth.”

“Longer, faster, and high-demand (traffic flow) links should be able to generate more revenues. If not maintained appropriately, link LOS [Level of Service] will decrease over time due to physical deterioration caused by the environment and traffic.”

“link expansion cost is positively correlated to lane-miles of expansion and road hierarchy (interstate, state highway, county highway, etc.), while negatively related to the distance from the nearest downtown” “most roads carry flows well below their capacity and a few roads operate at VC [volume capacity] ratios near or slightly higher than one. Practically, over a long period of time, no road can carry flows more than its capacity.”

 “some important system properties, such as road hierarchies and self-organization in transportation networks, can be predicted through a microscopic evolutionary process, a demonstration that such a microscopic agent-based model of network dynamics can be feasibly applied to large-scale realistic transportation networks, and an enquiry into how this concept can be realized and produce useful modeling tools for planners.”

Thursday, October 6, 2016

How well did London’s Congestion Charge Perform?

London Congestion Pricing – Implications for Other Cities (5 page pdf, Todd Litman, CESifo DICE Report 3/2005, Mar. 2005)

Today we review a paper that assessed the performance of the London Congestion Charge after it had operated for 2 years. The winners include bus and taxi users, pedestrians and cyclists and motorists with high value trips and most city centre businesses with congestion delays reduced reduced by 50% and net annual revenue of 97 million UK pounds to support transit/pedestrian and cycling infrastructure. Losers include motorists with marginal value trips and riders and motorists in border areas who a 10% increase in spillover traffic (but no more delay because of proactive action to adjust traffic signals). The London congestion charging system was a first for Europe and probably stimulated similar initiatives in Stockholm, Sweden Trondheim, Norway and Singapore in Asia.

 london-cong-ch  

Key Quotes:

“A basic economic principle is that consumers should pay directly for the costs they impose as an incentive to use resources efficiently. Urban traffic congestion is often cited as an example: if road space is unpriced traffic volumes will increase until congestion limits further growth”

“Since 17 February 2003 motorists driving in central London ..on weekdays between 7:00a.m.and 6:30 p.m.are required to pay £5,increasingto £8 in July 2005.”

 “Approximately 110,000 motorists a day pay the charge (98,000 individual drivers and 12,000 fleet vehicles),increasingly by mobile phone text message.”

“The2004/05 budget year is projected to earn £190 (instead of £160) million in total revenues (£118 million in fees and £72 million in fines), with £92 million in overhead expenses, resulting in £97 million in net revenues.”

“Prior to the congestion pricing program about12 percent of peak-period trips were by private automobile. During the programs first few months automobile traffic declined about 20 percent (a reduction of about 20,000 vehicles per day), resulting in a 10 percent automobile mode share”

"Peak period congestion delays declined about 30 percent, and bus congestion delays declined 50 percent. Bus ridership increased 14 per-cent and subway ridership about 1 percent.”

“Although there is 10 percent more traffic on the peripheral roads, journey times on them have not increased, in part because traffic signal systems on these roads were adjusted in anticipation of these traffic shifts"

 “This pricing program indicates that private automobile travel is more price sensitive than most experts believed. This is good news for congestion reduction but bad news for revenue generation.”

Tuesday, September 6, 2016

A Congestion Charge for Downtown Toronto: An Analysis

English: Toronto Downtown Core, at nite from C...
English: Toronto Downtown Core, at nite from CN Tower. Español: El centro de Toronto visto de noche. Français : Le centre-ville de Toronto, vu de nuit. (Photo credit: Wikipedia)
Revenue Options Study: Cordon Congestion Charges (185 page pdf, KPMG for City of Toronto, Jun. 2016)

Also discussed here: Report lays out hundreds of millions in potential new tax dollars for Toronto (Jeff Gray, Toronto Globe and Mail, Jun. 21, 2016)

Today we review a report by KPMG for the City of Toronto in which the option of a morning rush hour congestion charge is considered in the Toronto downtown south of the 401 between Bathurst and Bayview. Another road pricing option:applying a toll on the Don Valley Expressway is not included in this study and is being considered separately. A daily charge of $5 to $20 at each cordon would yield up to $377M/year in net revenue with 33% overhead. This in turn would cost the average household in Toronto $120 /year with 35% of the revenue coming from visitors.

The overall conclusion: “In general, a cordon charge would have a positive impact by reducing traffic, decreasing greenhouse gas emissions and increasing transit ridership.” and “The net revenue from cordon charges should have a high degree of stability in the long-term.” Implementation costs for congestion charges are high enough to consider as well the option of increasing parking rates in the downtown which would bring in similar revenues (and this seems to be favoured by the Mayor).


 Key Quotes:

Assumptions:

“The cordon charge will be applied only upon entry into the cordon zone between the hours of 6:00 am and 10:00 am on weekdays.”

"An electronic tolling system similar to the Highway 407 ETR will be used, which combines a transponder and licence plate recognition system. “

“The tolling of highways by the City is permitted under COTA; however, the highway or portion of road being designated as a toll road must first be approved by the Province. … COTA may need to be amended for Toronto to have the required authorities.”

 “It may be possible for the City to contract with the owners of Highway 407ETR (407 ETR Concession Company Ltd.) to operate and administer the City’s cordon charge program.
  • An annual commuting cost of $3,954 was used for price elasticity calculations.
  • There are 49 entry points into the cordon, based on the City of Toronto 2011 cordon analysis.
  • A price elasticity of -0.3 was used and compares similarly to London and Singapore’s elasticity.
“The net revenue from cordon charges ($377M/yr with a $20 cordon charge) should have a high degree of stability in the long-term.”

“While a cordon charge has many attractive features… similar benefits may be achieved at lower implementation cost by applying a levy to commercial parking spaces in the downtown core. “

“Parking space levy: Other cities, including Vancouver, Los Angeles, Miami, Pittsburgh and Seattle, tax either parking spots or parking revenues. Current legislation would only allow Toronto to levy a per-spot tax on landowners. A $1-a-day per-spot tax could bring in $383-million a year, according to KPMG’s estimates”

Tuesday, July 5, 2016

All about Carbon Pricing: Carbon Tax? Cap and Trade?

Putting a Price on Carbon: A Handbook for U.S. Policymakers (56 Page pdf, Kevin Kennedy, Michael Obeiter, And Noah Kaufman, World Resources Institute, Apr. 2015

 Today we review a handbook to implement carbon pricing- either by tax or by cap and trade- in the USA. Among the points noted were that a low to moderate tax alone would be “highly unlikely” to meet the UN’s goal of keeping global warming to less than 2 C (as recommended by 195 states at COP21 in Paris). Technological innovations subsidized by government are also needed and these can be funded from carbon tax revenue as well as other benefits such as tax cuts, return of money to households and electric users, and helping those directly harmed by carbon taxes as well as reducing national debt. Canada and the USA are well behind Scandinavian countries (such as Denmark, Finland, Norway, and Sweden, beginning in the early 1990s) to establish a national carbon tax, although at the sub-national level, California and Western states, British Columbia, Alberta, Ontario and Quebec have started to price carbon in recent years. Another interesting point is that a moderate carbon tax of $28/tonne applied to the USA would impact low income earners by 2.5% (and high earners by only 1%). This identifies the need to neutralize the regression effects by subsidizing the low income group by this amount.

  carbon pricing basics  

Key Quotes:

"A carbon price would lead to reductions in U.S. greenhouse gas emissions and create leverage to encourage other countries to reduce their emissions, both of which are necessary to prevent the more severe effects of climate change. In addition, reduced fossil fuel usage will provide “co-benefits” in the form of reduced emissions of other harmful air pollutants.”

Some Potential Benefits of Carbon Tax:
  • TAX CUTS. The revenues from carbon pricing could be used to fund cuts in other tax rates. …
  • RETURNING MONEY TO HOUSEHOLDS OR ELECTRICITY CONSUMERS. Revenue from carbon pricing could be returned to households by sending them “lump sum” payments, which could be divided equally or by some alternative metric….
  • DEFICIT REDUCTION….. Carbon pricing revenues could be used to reduce annual deficits and thereby help to avoid such adverse economic effects.
  • INVESTING IN COMBATING CLIMATE CHANGE. In addition to its potential to stimulate innovation in low-carbon technologies (for example, renewable energy), a carbon price can provide revenue to help promote the development and deployment of breakthrough technologies
  • TRANSITIONAL ASSISTANCE. A portion of the revenues can be used to assist those likely to be most adversely affected by a carbon price…”
“A carbon tax is in some ways simpler than a cap-and-trade program. A tax does not require the government to allocate or conduct auctions for emissions allowances, or monitor the trading of allowances, and regulated entities do not need to participate in auctions or secondary markets for allowance trading.”

“The major advantage of a cap-and-trade program is that the policy sets a firm limit on the quantity of emissions that will be allowed.”

 “It is highly unlikely that a low to moderate carbon tax would achieve the level of emissions reductions the Intergovernmental Panel on Climate Change (IPCC) recommends in order to prevent the worst impacts of climate change”

“The longest-running programs are the carbon taxes established by Denmark, Finland, Norway, and Sweden in the early 1990s. National carbon taxes have also been established in recent years in France, Iceland, India, Ireland, Japan, Mexico, Switzerland, and the United Kingdom,”

 “Government support of research, development, and demonstration of measures to reduce emissions from energy, transportation, agriculture, or other sectors can fill the gap created by private sector under-investment, and help bring down the costs of breakthrough technologies. This, in turn, could help to drive more cost-effective emissions reductions and reduce the cost of complying with the carbon tax.”

“CBO has found that a carbon tax of $28 per metric ton of CO2 emissions would increase after-tax costs for the average household in the lowest quintile of the income distribution by 2.5 percent; for households in the top quintile, the carbon tax would increase after-tax costs by only one percent.”