Showing posts with label roads. Show all posts

Tuesday, January 31, 2017

Living Close to Traffic and the Risk of Dementia

Living close to major roads linked to small increase in dementia risk (Abstract, the Lancet, Jan.4, 2017)

Also discussed here: Living near major roads is associated with increased dementia risk, study finds (Susan Mayor, The British Medical Journal, Jan. 5, 2017)

And here: Living near major traffic linked to higher risk of dementia (Public Health Ontario, Jan. 4, 2017)

And here: Does Living by a Busy Road Boost Dementia Risk? Exposure to heavy traffic tied to cognitive decline (Alexandria Bachert , MedPage Today, Jan. 4, 2017)

Today we review a study with over 6.5 million people living in Ontario that examined the impact of living near high traffic roadways and the incidence of dementia, the first time such a study has been conducted in Canada. Results indicate a 7 percent higher risk for those who live within 50m (half a city block)compared to those who live more than 200 m from these roadways who have no higher risk. The specific pollutants found responsible include PM2.5 and NO2. Interesting that other neurological disorders such as Parkinson's disease or multiple sclerosis were found to not have a higher risk.

 dementia  

Key Quotes:

 “Dementia is more common in people who live within 50 metres of a major road than those who live further away.. up to one in 10 (7-11%) cases of dementia among those who live within 50 metres of a major road [1] could be attributed to traffic exposure”

“While there was no association between living near a road and Parkinson's disease or multiple sclerosis, dementia was more common the closer people lived to busy roads.”

 “The risk of developing dementia reduced as people lived further away from a main road - with a 7% higher risk in developing dementia among those living within 50 metres, a 4% higher risk at 50-100 metres, a 2% higher risk at 101-200 metres and no increase in risk in those living more than 200 metres away.”

"Our study suggests that busy roads could be a source of environmental stressors that could give rise to the onset of dementia. Increasing population growth and urbanisation has placed many people close to heavy traffic, and with widespread exposure to traffic and growing rates of dementia, even a modest effect from near-road exposure could pose a large public health burden. More research to understand this link is needed, particularly into the effects of different aspects of traffic, such as air pollutants and noise."

 "The significant association of newly diagnosed cases of dementia in the study period between 2001 and 2012 with the proximity to traffic road less than 50 m-300 m versus more than 300 m, and the robust observation of dementia involving predominantly urban versus rural residents, opens up a crucial global health concern for millions of people..”

“exposures to nitrogen dioxide (NO2) and fine particulate matter (PM2.5) on the basis of postal code addresses were related to dementia, and adjusting for these two pollutants attenuated its association with roadway proximity. This showed that the effect of living near a busy road may, at least in part, operate through this mechanism”

Tuesday, December 27, 2016

How do Air Pollution and Noise from Road Traffic affect High Blood Pressure in Western Europe?

English: Main complications of persistent high...
English: Main complications of persistent high blood pressure. Sources are found in main article: Wikipedia:Hypertension#Complications. To discuss image, please see Template_talk:Häggström diagrams. To edit, please use the svg version, convert to png and update both versions online. (Photo credit: Wikipedia)
Long-term exposure to ambient air pollution and traffic noise and incident hypertension in seven cohorts of the European study of cohorts for air pollution effects (ESCAPE) (Abstract, Kateryna B Fuks, Gudrun Weinmayr, Xavier Basagaña, Olena Gruzieva, Regina Hampel, Bente Oftedal, Mette Sørensen, Kathrin Wolf, Geir Aamodt, Gunn Marit Aasvang, Inmaculada Aguilera, Thomas Becker, Rob Beelen, Bert Brunekreef, Barbara Caracciolo, Josef Cyrys, Roberto Elosua, Kirsten Thorup Eriksen, Maria Foraster, Laura Fratiglioni, Agneta Hilding, Danny Houthuijs, Michal Korek, Nino Künzli, Jaume Marrugat, Mark Nieuwenhuijsen, Claes-Göran Östenson, Johanna Penell, Göran Pershagen, Ole Raaschou-Nielsen, Wim Swart Jr, Annette Peters, Barbara Hoffmann, European Heart Journal, Oct. 24, 2016) 


Key Quotes: 

“Long-term exposure to air pollution is linked to a greater incidence of high blood pressure, according to the largest study to investigate the effects of both air pollution and traffic noise by following over 41,000 people in five different countries for five to nine years.” 

 “among adults, up to one extra person per 100 people of the same age group living in the most polluted areas of cities would develop high blood pressure (hypertension) compared to those living in the less polluted areas…similar to the effect of being overweight with a body mass index (BMI) between 25-30 compared to people with normal weight” 

“for every five micrograms [2] per cubic metre (5 µg/m3) of PM2.5, the risk of hypertension increased by a fifth (22%) in people living in the most polluted areas compared to those in the least polluted areas” 

“people living in noisy streets, where there were average night time noise levels of 50 decibels, had a six percent increased risk of developing hypertension compared to those living on quieter streets where average noise levels were 40 decibels during the night.” 

“there were higher average levels of pollution in the central and southern European study areas -- Germany and Spain -- than in the Scandinavian areas -- Norway, Sweden and Denmark. Exposure to traffic noise and traffic load was highest in the study areas of Sweden and Spain.”    

Tuesday, December 20, 2016

How Can The US Transportation Become Carbon Free by 2050?


Also discussed here: Report: Global Warming Solutions (Environment America Research & Policy Center, Oct. 24, 2016)

Today we review a report that recommends 50 steps aimed at state and federal program and policies that could make the USA’s transportation system carbon free by 2050. The steps include making carbon reduction strategies a key priority by exploiting the growth of electric vehicles, autonomous vehicles and the sharing of cars and bicycles, adding more effective public transit, employing smart pricing policies and phasing out carbon intensive vehicles and fuels.

 co2-emissions-by-country  
Key Quotes:

“Efficient electric vehicles that can be powered by clean, renewable electricity are entering the marketplace faster than the hybrid cars of a decade ago “

“An explosion of technology-enabled services – from carsharing to bikesharing to Lyft and Uber – has begun to revolutionize transportation in many cities. “

 “Public transportation reduces vehicle travel (and greenhouse gas emissions) by about 10 percent in U.S. cities, and cities across the country are considering bold plans to expand access to high-quality transit.”

“Cities around the world have shown that smart pricing policies can reduce congestion and encourage the use of low-carbon modes of travel.”

 “autonomous vehicles can be deployed in ways that can support efforts to reduce greenhouse gas emissions – especially if they facilitate the use of shared mobility services, vehicle electrification and smart pricing, and if public policy limits any increases in vehicle travel resulting from automation.”

 “Principles:
  • Climate concerns should inform every transportation policy decision…Only seven states have enforceable, economy-wide limits on carbon pollution, and, as of 2012, the vast majority of states and metropolitan planning organizations did not even consider greenhouse gas emissions in agency planning processes.
  • Low-carbon transportation should be at the front of the line for public funding … Between 1956 and 2014, 79 percent of all government capital expenditures on transportation went toward highways,
  • People should be rewarded for making low-carbon transportation choices….income tax exclusion for commuter parking subsidizes rush hour driving to the tune of more than $7 billion per year.
  • Carbon-intensive vehicles and fuels should be phased out…Federal policies have failed to tap the potential of lower-carbon fuels, with the federal Renewable Fuels Standard currently serving largely to encourage the use of corn ethanol
  • Public policy should encourage climate-friendly communities…some localities have begun to lift mandatory minimum parking requirements that add to the cost of new housing development and consume precious and limited urban space.
  • Public policy should foster innovation…Key state and federal policies hamper innovation by failing to account for changing circumstances such as the emergence of shared mobility services or growing demand for urban living, or by locking officials into spending or policy practices more attuned to the needs of a previous generation.”

Thursday, December 1, 2016

How do Travel Demand and Economics Affect the Development of Urban Road Networks?

A Model of the Rise and Fall of Roads (33 page pdf, Zhang, Lei, Levinson, David M, Systems Symposium at the Massachusetts Institute of Technology, Mar. 2004)

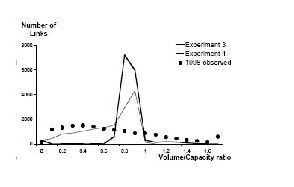
Today we review a seminal paper from over a decade ago that examines the dynamics of road development in a major mid-West American city (Minneapolis-Saint Paul) using a model that combines measures such as travel demand statistics (usually found on Origin Destination studies) with the economics of road pricing or tolls, geographical constraints (such as rivers and mountains) and how these change with newer technology over time (in this case over 20 years). Roads represent both figuratively and physically the link that join the issues addressed in this blog: how traffic is linked to pollution and how pollution is linked to health. Of particular interest is the way that travel demand and road volume capacity (VC) interact with road tolls and the cost of road construction and the resulting revenue that may be used to ease congestion, in addition to the overall design of the road network and design for a major urban area. road-links  

Key Quotes:

 “In 1900 there were 240 km of paved road in the United States … and this total had increased to 6,400,000 by 2000 …with virtually 100% of the U.S. population having almost immediate access to paved roadways.”

“questions yet to be answered: (1) How do the existing links (roads) develop and degenerate? (2) How are new links added to the existing network? (3) How are new nodes added to the existing network?” “the Twin Cities transportation network which comprises nearly 8,000 nodes and more than 20,000 links, using network data collected since year 1978”

Specific questions on the rise and falls of roads:
  1. “Why do links expand and contract?
  2. Do networks self-organize into hierarchies?
  3. Are roads (routes) an emergent property of networks?
  4. What are the parameters to be calibrated in a microscopic network dynamics model?
  5. Is the model computationally feasible on a realistic transportation network?
  6. Is the model capable of replicating real-world network dynamics?”
“economic growth is a two-way interaction between the economy and technology; technological research transforms the economy that finances it.. transportation investment drives the growth that funds it.” “In developed countries where transportation infrastructure has reached its saturated stage, it is rare to see new network growth from a tabula rasa. Even in an empty place without any previous developments, natural barriers such as rivers and mountains still impose constraints on future network growth.”

“Longer, faster, and high-demand (traffic flow) links should be able to generate more revenues. If not maintained appropriately, link LOS [Level of Service] will decrease over time due to physical deterioration caused by the environment and traffic.”

“link expansion cost is positively correlated to lane-miles of expansion and road hierarchy (interstate, state highway, county highway, etc.), while negatively related to the distance from the nearest downtown” “most roads carry flows well below their capacity and a few roads operate at VC [volume capacity] ratios near or slightly higher than one. Practically, over a long period of time, no road can carry flows more than its capacity.”

 “some important system properties, such as road hierarchies and self-organization in transportation networks, can be predicted through a microscopic evolutionary process, a demonstration that such a microscopic agent-based model of network dynamics can be feasibly applied to large-scale realistic transportation networks, and an enquiry into how this concept can be realized and produce useful modeling tools for planners.”

Tuesday, November 29, 2016

The Tire and Brake Share of Traffic-Related Air Pollution

Studded tyre Español: Neumático de invierno co...
Studded tyre Español: Neumático de invierno con clavos, modelo Nokian Hakkapeliitta 4 (Photo credit: Wikipedia)


Key Quotes: 

“Tyre rubbish is the 13th largest source of air pollution in Los Angeles, California, a city famous for its smog. A recent study showed links between PM2.5 particles and the daily death rate in 6 Californian counties. When the PM2.5 count was high, so was the death rate” 

 “research now contends possible links to lung cancer from recycling some of the 1 billion dead tyres used in, for example, the surfaces of playgrounds. Some are calling it the new asbestos” 

“there are over 1 billion cars on the road globally and on top of that just as many motorbikes and scooters. Add to that the pneumatic tyres used on trucks and public transport such as metro train systems and buses and we have a considerable source of road rubber. A road with 25,000 vehicles using it each day can produce up to nine kilograms of tyre dust per kilometre.”

 “Oslo announced a plan to ban all cars from its city centre in 2019; and Norway is in the process of preparing a bill that would issue a nation-wide ban of the sale of petrol-powered cars. In places such as Tuscany, cars are banned in city centres except for residents.”

Thursday, October 6, 2016

How well did London’s Congestion Charge Perform?

London Congestion Pricing – Implications for Other Cities (5 page pdf, Todd Litman, CESifo DICE Report 3/2005, Mar. 2005)

Today we review a paper that assessed the performance of the London Congestion Charge after it had operated for 2 years. The winners include bus and taxi users, pedestrians and cyclists and motorists with high value trips and most city centre businesses with congestion delays reduced reduced by 50% and net annual revenue of 97 million UK pounds to support transit/pedestrian and cycling infrastructure. Losers include motorists with marginal value trips and riders and motorists in border areas who a 10% increase in spillover traffic (but no more delay because of proactive action to adjust traffic signals). The London congestion charging system was a first for Europe and probably stimulated similar initiatives in Stockholm, Sweden Trondheim, Norway and Singapore in Asia.

 london-cong-ch  

Key Quotes:

“A basic economic principle is that consumers should pay directly for the costs they impose as an incentive to use resources efficiently. Urban traffic congestion is often cited as an example: if road space is unpriced traffic volumes will increase until congestion limits further growth”

“Since 17 February 2003 motorists driving in central London ..on weekdays between 7:00a.m.and 6:30 p.m.are required to pay £5,increasingto £8 in July 2005.”

 “Approximately 110,000 motorists a day pay the charge (98,000 individual drivers and 12,000 fleet vehicles),increasingly by mobile phone text message.”

“The2004/05 budget year is projected to earn £190 (instead of £160) million in total revenues (£118 million in fees and £72 million in fines), with £92 million in overhead expenses, resulting in £97 million in net revenues.”

“Prior to the congestion pricing program about12 percent of peak-period trips were by private automobile. During the programs first few months automobile traffic declined about 20 percent (a reduction of about 20,000 vehicles per day), resulting in a 10 percent automobile mode share”

"Peak period congestion delays declined about 30 percent, and bus congestion delays declined 50 percent. Bus ridership increased 14 per-cent and subway ridership about 1 percent.”

“Although there is 10 percent more traffic on the peripheral roads, journey times on them have not increased, in part because traffic signal systems on these roads were adjusted in anticipation of these traffic shifts"

 “This pricing program indicates that private automobile travel is more price sensitive than most experts believed. This is good news for congestion reduction but bad news for revenue generation.”

Thursday, March 3, 2016

What are the Health Impacts from Roadside Emissions while Reducing Greenhouse Gases?

Near-Roadway Air Pollution and Coronary Heart Disease: Burden of Disease and Potential Impact of a Greenhouse Gas Reduction Strategy in Southern California (8 page pdf, Rakesh Ghosh, Frederick Lurmann, Laura Perez, Bryan Penfold, Sylvia Brandt, John Wilson, Meredith Milet, Nino Künzli, and Rob McConnell, Environmental Health Perspectives, Feb. 1, 2016)

Today we review research into the impact of roadside emissions for people living near (within 50 m) of major highways in Southern California. While various policies have been put in place recently and into the future to reduce PM2.5 and greenhouse gas emissions, this study concentrated on the specific health impacts from roadside gases as they affect coronary heart disease. Results indicate that although emissions have lessened that more and more people live closer to the highways so that the health impacts become greater. Several options are suggested to alleviate this including a switch to zero emission electric vehicles and putting a buffer between the highways and residential areas.

  south calif health  

Key Quotes:

“Emerging evidence suggests a causal link between near-roadway air pollution (NRAP) and coronary heart disease (CHD) mortality and morbidity”

“The total SoCAB [California’s South Coast Air Basin ] population was 15.5 million in 2008 and is projected to increase by approximately 3 million in 2035. However, the proportion ≥ 45 years at risk for CHD is expected to increase from 35% in 2008 to 43% in 2035”

“the proportion of the population living within 150m from a freeway or 50m from a major road is expected to increase from 8.3% to 10.9% from 2008 to 2035 “

“The overall pattern of changing exposure and NRAP-attributable CHD was generally similar across all SoCAB counties. Traffic density and EC levels were highest in Los Angeles County and lowest in Riverside County and are projected to decrease in all four counties from 2008 to 2035.”

“In contrast, the proportion living near a major road is projected to increase in all counties during the same period.”

“Estimates of the 2008 preventable CHD mortality due to NRAP among the ≥45 years population in the SoCAB varied from 2.4% (430 deaths), based on effects of residential proximity to a major road, to 6.8% (1,300 deaths), based on emissions-weighted traffic density”

 “The 2035 greenhouse gas reduction–planning scenario is projected to result in reduced population exposure and reduced PAF for PM 2.5, traffic density, and EC (but not for residential proximity to major roadways)”

 “if this planning scenario increases the population exposed to NRAP by placing people closer to busy roadways, they may be put at increased CHD risk, unless vehicle emissions were to decrease more substantially than currently anticipated”

"Variants on the planning scenario, such as policies to develop a zero- or close-to-zero-emission vehicle fleet, could optimize health co-benefits of greenhouse gas reduction. Another approach might be to encourage buffers between major traffic corridors and high-density development through zoning and other land use policies. “

Thursday, December 3, 2015

What Are the Health Implications of Using Coal-Tar Sealants on Driveways and Parking Lots?

Ball-and-stick model of the retene molecule, a...
Ball-and-stick model of the retene molecule, a polycyclic aromatic hydrocarbon present in coal tar. (Photo credit: Wikipedia)
Studies Raise Questions about Pavement Sealers (2 page pdf, Environ Health Perspect. 2012 May 1, 2012)

Also discussed here: Public Health Statement - Polycyclic Aromatic Hydrocarbons (Pahs) (6 Page Pdf, Department Of Health And Human Services, Public Health Service Agency For Toxic Substances And Disease Registry, Center For Disease Control, Aug. 1995)

And here: A review of airborne polycyclic aromatic hydrocarbons (PAHs) and their human health effects (Abstract, Ki-Hyun Kim, Shamin Ara Jahan, Ehsanul Kabir, Richard J.C. Brown, Atmospheric Environment, Oct. 2013)

 Today we review a short article that discusses the pros and cons of applying a sealant to driveways. The biggest pro is improving the cosmetic appearance of the driveway. The biggest con is that coal-tar based sealants act as source of polycyclic aromatic hydrocarbons (PAHs) for as long as eight years after the initial application, in addition to producing14.5 times higher concentration of PAH-contaminated indoor dust in residences located next to treated pavements. An asphalt pavement structure should last virtually forever if a thin coat of repaving is applied after 20 years along with interim crack sealing. The health impacts from exposure to PAH for long periods include a higher risk of cancer as well as cataracts, kidney and liver damage and jaundice.  


Key Quotes:

"Asphalt is used extensively to pave parking lots, driveways, airport runways, roads, playgrounds, paths, and other surfaces. … can help prevent pavement degradation and improve appearance, and they are used across the United States on all types of asphalt surfaces, with the exception of roads. “

“Coal tar–based sealers contain an average concentration of 16 polycyclic aromatic hydrocarbons (PAHs) about 1,300 times greater than that found in asphalt-based sealers” “ingestion of PAH-contaminated indoor dust via hand-to-mouth contact was on average 14.5 times higher for young children living in apartments next to parking lots treated with coal tar–based sealer compared with children living next to untreated parking lots.”

“During the hottest part of the day they found that average concentrations of eight PAHs about an inch above the surface were 19 times greater for the coal tar–treated lots than for unsealed lots, and were 5 times greater about four feet above the surface”

“The PAH concentrations over the sealed lots were 3.2 times greater during the heat of the day than during the coolest part of the day, and the average rate of volatilization during the day was 62 times greater for coal tar–treated lots than for unsealed lots, “

“in the United States each year, the mass of emissions of six major PAHs within the first 16 days after application of all coal tar–based sealer projects may be about 20 times greater than that from all annual vehicle emissions.”

“PAHs can be harmful to your health under some circumstances. Several of the PAHs… have caused tumors in laboratory animals when they breathed these substances in the air, when they ate them, or when they had long periods of skin contact with them. Studies of people show that individuals exposed by breathing or skin contact for long periods to mixtures that contain PAHs and other compounds can also develop cancer.”

“The occurrence of PAHs in ambient air is an increasing concern because of their carcinogenicity and mutagenicity.”

“Health effects from chronic or long-term exposure to PAHs may include cataracts, kidney and liver damage and jaundice. “

Tuesday, December 1, 2015

Is Exposure to Short-term Roadside Emissions a Greater Health Risk for Children?

Nitrogen dioxide, a large contributor to the p...
Nitrogen dioxide, a large contributor to the production of smog (Photo credit: Wikipedia)
Greater nitrogen dioxide concentrations at child versus adult breathing heights close to urban main road kerbside (7 page pf, Hannah S. Kenagy, Chun Lin, Hao Wu & Mathew R. Heal, Air Qual Atmos Health, Sep. 3, 2015)

Roadside emissions have been shown to pose a health threat for people living or travelling close to the roads but the studies have been restricted to measuring the exposure several metres above ground rather than at the same level as the exhaust itself or for people breathing in the pollution at different heights. Today we review research into this question with a focus on how this may pose a greater threat for children either walking or in a stroller/buggie at lower heights than their accompanying adults. Results indicate that NO2 concentration levels are 5 to 15% higher closer to the ground within 1.2 m of the side of the road or curb- with other actors such as windspeed kept constant. This has health implications for children near roads with heavy traffic (above 12,000 vehicles per day which is typical for a 2 lane busy urban road) and might suggest a greater setback for sidewalks for example.


Key Quotes: 

“The focus of this study was on possible differences in NO2 concentrations between adult and child heights as a function of different distances from heavily trafficked roads in urban areas” 

“Short-term variations in NO2 have been linked to increased hospitalisations, respiratory symptoms, and mortality, while long-term exposure to NO2 has also been associated with both morbidity and mortality” 

 “Measurements by passive diffusion tubes at differing distances from main roads in Edinburgh, UK, have shown NO 2 concentrations at 0.8 m above the ground to be significantly greater than NO2 concentration at 2.0 m above the ground, for distances up to at least 1.2 m from the kerbside of heavily trafficked (annual average daily traffic counts >12,000) urban roads. “ 

“Concentrations at the lower height were 5 – 15 % or a few micrograms per cubic metre greater, on average at the lower height than at the higher height.” 

“These observations clearly have potential public health implications as they show that children walking, or in buggies, close to busy roads can be exposed to NO2 concentrations several percent (or a few μgm−3) greater than adults at the same locations”

Thursday, August 13, 2015

How Do Electric Fields under High Voltage Power Lines Compare to Those Near Highways?

Comparison of charged nanoparticle concentrations near busy roads and overhead high-voltage power lines (Abstract, E.R. Jayaratne, X. Ling, L. Morawska, May 28, 2015)

Also discussed here: Roadside air can be more charged than under a high-voltage power line (Science Daily, May 28, 2015)

Today we review research from Brisbane, Australia, comparing the number of charged particles emitted by vehicles near highways to what is found under power lines. Results indicate more than twice as many charged vehicles near roads. The charges alone do not present a health hazard but the fact that the particulates are charged means that they adhere more closely to the lungs when they are breathed in – and this as earlier research has shown presents a number of health impacts which would be increased by the electrical charging

 freeway electric field  

Key Quotes:

 “ a large number of charged particles in urban environments come from motor vehicle emissions ….within 10 metres of a freeway, charged particles were up to 15 times more concentrated than beneath high-voltage power lines."

 “the concentration of charged nanoparticles found near two freeways carrying around 120 vehicles per minute exceeded the corresponding maximum concentrations under two corona-emitting overhead power lines by as much as a factor of 5”

“most pronounced when a significant fraction of traffic consisted of heavy-duty diesel vehicles which typically have high particle and charge emission rates.”

“while there was no evidence that breathing in air ions was a health risk, approximately one-half of the fine particles that we inhale during normal breathing are deposited in our lungs. Therefore, it is not surprising that several studies have demonstrated a link between particulate pollution from exhaust fumes and adverse health effects.”

 "We do not believe that ions are dangerous -- the danger comes from the pollutants. The ions merely assist the particles to stick to the lungs. If there are no dangerous particles in the air to attach to the ions, there is no risk of ill health."

Thursday, July 16, 2015

How Will Norway Deal with Less Fuel Tax Revenue while Reducing Carbon Emissions?

Norway reviewing future of fuel tax (Road Pricing, Apr. 24, 2015)

 Today we review a short note on the status of fuel taxes and road tolls in Norway which like Canada is blessed with both considerable hydroelectric power and oil and natural gas resources. Norway has a much greater network of roads with tolls as well as many more electric cars than Canada. With the drop in oil prices and, as a result, reduced revenue from fixed fuel taxes, both countries have to decide how to manage the revenue side from fuel taxes and road pricing, as well as the movement toward lower carbon emissions which has been boosted by various incentives for electric cars (which tends to favour higher income owners) which are not available for heavy vehicles and trucks. The resulting decision may favour higher tolls. This is one option not available to oil producing countries, such as the USA and Canada, where tolling is much less seen.


Norway toll roads  

Key Quotes:

"Incentives for electric cars: 
  • Toll free use of roads; 
  • Zero charges for public car parks; 
  • Access to bus lanes; 
  • Free use of car ferries; 
  • -Free use of public vehicle charge points.” 

“20% of all vehicles sold last year were electric, with Norway alone representing one third of all such vehicles sold in Europe “

“Norway has many toll roads, not just the relatively well known Oslo toll ring (which effectively operates as a congestion charging cordon), but on major highways across the country, with 40 currently listed”

“Fuel tax is US$3.87 per gallon (US$1.02 per litre) including a tax on CO2.”

“its neighbour Sweden has an influence, as having taxation [on fuel] significantly lower than Sweden will encourage some informal and illegal trade across the border”