Showing posts with label infrastructure. Show all posts

Thursday, December 29, 2016

What is Important for Coastal Areas Facing Sea-Level Rise - A Literature Review

Resilience of Infrastructure Systems to Sea-Level Rise in Coastal Areas: Impacts, Adaptation Measures, and Implementation Challenges (28 page pdf, Beatriz Azevedo de Almeida and Ali Mostafavi, Sustainability, Nov. 1, 2016)

Today we summarize a literature review of research papers examining the impacts of sea level rise on coastal areas of the world which include flooding, coastal erosion, land subsidence and saltwater intrusion. A rise of only ½ a meter in the next 50 years puts at risk 150 million people and $35 trillion of assets in 20 of the world’s most vulnerable port cities. Any success in reducing carbon emissions and the associated increase via climate change in temperature, precipitation and sea level rise would allow for 30% less impact on infrastructure systems such as power stations, oil and gas refineries and wastewater treatment plants.

 sea-level-rise-impacts  

Key Quotes:

“Expansive areas of low elevation in many densely populated coastal areas are at elevated risk of storm surges and flooding due to torrential precipitation, as a result of sea level rise.”

 “A 100-year storm surge, which is expected to begin occurring every 3–20 years, could cost billions of dollars in direct damages after 1 foot of sea-level rise” “Salt water intrusion into groundwater aquifers is one of the major impacts of sea-level rise.”

“there are 136 major port cities with more than one million inhabitants each, 13 of which are among the top 20 most populated cities in the world.”

 “Many of the world’s infrastructure facilities such as power generation facilities, refineries stations, water and wastewater treatment plants, and transportation networks are located along coastlines. As sea levels rise and coastlines erode, infrastructures are more exposed to the forces of nature and becoming structurally unstable.”

“groundwater inundation caused by sea level rise reduces the drainage capacity of storm water systems, and thus, could affect drainage and runoff infiltration…. during Hurricane Sandy in 2012, sewage backup led to the overflow of 11 billion gallons of raw sewage into the streets, rivers, and coastal waters”

 “In the U.S., a great number of coastal energy facilities are located in areas exposed to 4 feet sea-level rise. An analysis …identified 287 energy facilities at risk of flooding, spreading throughout 22 coastal states. These facilities include natural gas infrastructures, electric power plants, and oil and gas refineries.”

 “Global climate models suggest that global average sea level might rise 18–59 cm by 2100, if ice sheets continue to melt at the rate observed from 1993 to 2003. If the rate increases at the same trend as global temperatures warm, total sea level rise by 2100 might be 10–20 cm greater than the average projections.”

Thursday, December 15, 2016

What Factors are Important for Coastal Cities Facing Sea-Level Rise - A Literature Review

Resilience of Infrastructure Systems to Sea-Level Rise in Coastal Areas: Impacts, Adaptation Measures, and Implementation Challenges (28 page pdf, Beatriz Azevedo de Almeida and Ali Mostafavi, Sustainability, Nov. 1, 2016)

Today we summarize a literature review of research papers examining the impacts of sea level rise on coastal areas of the world which include flooding, coastal erosion, land subsidence and saltwater intrusion. A rise of only ½ a meter in the next 50 years puts at risk 150 million people and $35 trillion of assets in 20 of the world’s most vulnerable port cities. Any success in reducing carbon emissions and the associated increase via climate change in temperature, precipitation and sea level rise would allow for 30% less impact on infrastructure systems such as power stations, oil and gas refineries and wastewater treatment plants.

 sea-level-rise-impacts  

Key Quotes:

 “Expansive areas of low elevation in many densely populated coastal areas are at elevated risk of storm surges and flooding due to torrential precipitation, as a result of sea level rise.”

“A 100-year storm surge, which is expected to begin occurring every 3–20 years, could cost billions of dollars in direct damages after 1 foot of sea-level rise”

 “Salt water intrusion into groundwater aquifers is one of the major impacts of sea-level rise.” “there are 136 major port cities with more than one million inhabitants each, 13 of which are among the top 20 most populated cities in the world.”

“Many of the world’s infrastructure facilities such as power generation facilities, refineries stations, water and wastewater treatment plants, and transportation networks are located along coastlines. As sea levels rise and coastlines erode, infrastructures are more exposed to the forces of nature and becoming structurally unstable.”

“groundwater inundation caused by sea level rise reduces the drainage capacity of storm water systems, and thus, could affect drainage and runoff infiltration…. during Hurricane Sandy in 2012, sewage backup led to the overflow of 11 billion gallons of raw sewage into the streets, rivers, and coastal waters”

“In the U.S., a great number of coastal energy facilities are located in areas exposed to 4 feet sea-level rise. An analysis …identified 287 energy facilities at risk of flooding, spreading throughout 22 coastal states. These facilities include natural gas infrastructures, electric power plants, and oil and gas refineries.”

“Global climate models suggest that global average sea level might rise 18–59 cm by 2100, if ice sheets continue to melt at the rate observed from 1993 to 2003. If the rate increases at the same trend as global temperatures warm, total sea level rise by 2100 might be 10–20 cm greater than the average projections.”

Thursday, August 25, 2016

A Carbon Capture and Storage (CCS) Technique that Might Actually Work

Rapid carbon mineralization for permanent disposal of anthropogenic carbon dioxide emissions (4 page pdf, Juerg M. Matter, Martin Stute, Sandra Ó. Snæbjörnsdottir, Eric H. Oelkers, Sigurdur R. Gislason, Edda S. Aradottir, Bergur Sigfusson, Ingvi Gunnarsson, Holmfridur Sigurdardottir, Einar Gunnlaugsson, Gudni Axelsson, Helgi A. Alfredsson, Domenik Wolff-Boenisch, Kiflom Mesfin, Diana Fernandez de la Reguera Taya, Jennifer Hall, Knud Dideriksen, Wallace S. Broecker, Science, Jun.10, 2016)

Also discussed here: Climate change mitigation: Turning carbon dioxide into rock (Science Daily, Jun. 9, 2016)

Today we review research conducted in Iceland into a technique that converts atmospheric CO2 into a carbonate solid for storage underground rather than the better known CCS approach which attempts to store CO2 underground in its gaseous state, with all of the risks of it leaking back into the atmosphere later. Preliminary testing and drilling near Reykjavik indicate that up to 5,000 tonnes of CO2/year can be stored this way. The feasibility for this to significantly address global emissions will be tested when this technique is scaled up to much larger rates.

 co2 injection site  

Key Quotes:

“The CarbFix pilot project in Iceland was designed to promote and verify in situ CO2 mineralization in basaltic rocks for the permanent disposal of anthropogenic CO2 emissions …. is situated about 25 km east of Reykjavik and is equipped with a 2000-m-deep injection well (HN02) and eight monitoring wells ranging in depth from 150 to 1300 m”

“greenhouse gas carbon dioxide (CO2) can be permanently and rapidly locked away from the atmosphere, by injecting it into volcanic bedrock. The CO2 reacts with the surrounding rock, forming environmentally benign minerals….Our results show that between 95 and 98 per cent of the injected CO2 was mineralised over the period of less than two years, which is amazingly fast."

“The CO2 is dissolved in water and carried down the well. On contact with the target storage rocks, at 400-800 metres under the ground, the solution quickly reacts with the surrounding basaltic rock, forming carbonate minerals.”

 "Carbonate minerals do not leak out of the ground, thus our newly developed method results in permanent and environmentally friendly storage of CO2 emissions,"

 "Storing CO2 as carbonate minerals significantly enhances storage security which should improve public acceptance of Carbon Capture and Storage as a climate change mitigation technology,"

“The results of this study demonstrate that nearly complete in situ CO2 mineralization in basaltic rocks can occur in less than 2 years. Once stored within carbonate minerals, the leakage risk is eliminated and any monitoring program of the storage site can be significantly reduced, thus enhancing storage security and potentially public acceptance.”

Thursday, July 14, 2016

What Links Urban Metabolic Energy Flows and Urban Ecosystems – a literature review.

Eight energy and material flow characteristics of urban ecosystems (12 page pdf, Xuemei Bai, Ambio, Apr. 22, 2016)

Today we examine a review of current literature about two apparently conflicting urban concepts: one that is concerned with the material energy flows, the other with the ecology of wildlife and plants in a city environment. As cities become more complex and larger these concepts become more important in themselves, as well as between each other with intercity distributions and the regulation of processes across large urban areas and estimating the capacity of a city when to comes to the flow of materials, such as waste Approaching cities in this way also allows for a better defined environmental footprint, as demonstrated in one example in Barcelona, where a park designed for carbon sequestration was found after analysis to be one twelve the size needed to produce the desired absorption of carbon emissions from the city. The concluding words are worth noting: “A better understanding of the interactions between anthropogenic material and energy flows and ecosystem processes can help reduce unintended consequences of narrowly focused policy and management decisions.”

 urban metabolism  

Key Quotes :

 « The concept of urban metabolism has been widely used to study energy and material flows into and out of cities… recent urban energy and material flow studies have extended far beyond the original metaphor of cities as organism, and started to reveal important characteristics of urban system features and interactions.. Urban energy and material flow efficiency can be defined as how much social/economic services per unit of resource consumption or waste generation can support. It shows how efficient the urban system is in supporting its function, and is an important system performance indicator.”

“The input part of the urban metabolism includes various tangible materials such as food, water, construction and other materials, products, energy, as well as inflow of energy, capital, information, and people. Such input supports societal activities and drives urban functions within a city; forms urban stocks such as housing, building, infrastructure, and green parks; and produces products and services, as well as managed and unmanaged waste and emissions.”

“The output part consists of industrial products, services, knowledge, and various wastes and emissions. The magnitude, distribution, and internal interactions and feedbacks are regulated by policy, governance, culture, and individual and collective behaviour of the urban system.”

 “Understanding biogeochemical budgets of ecosystems, in particular nutrients such as carbon, nitrogen, and phosphorus, has been one of the crucial elements of urban ecology” “The metabolic budget can be used to assess the total ecological footprints of cities”

 “The total budget and pathways of material and energy flows reveal the magnitude of impacts and other important characteristics of urban system, such as the functional role of the city, development stages (i.e., mature or growing city), level of infrastructure and development, income, and other socioeconomic characteristics of the city”

Tuesday, July 12, 2016

What is the Impact of Hydraulic Fracturing?

Fracking Communities (22 page pdf, Colin Jerolmack and Nina Berman, Climate Change and the Future of Cities: Mitigation, Adaptation, and Social Change on an Urban Planet, Public Culture, Duke University Press, May 2, 2016)

Also discussed here: Fracking Hits Milestone as Natural Gas Use Rises in U.S. (Bobby Magill, Climate Central, May 6, 2016)

Today we review an article that chronicles the impact fracking has and is having on rural communities and the natural forests and parks that lie among them. Although fracking natural gas (and closing coal plants) has been credited with the 12% reduction in CO2 in the USA from 2007 to 2012, the process involves over 1,000 truckloads of water for just one well and 1,020 shale wells have been approved in Pennsylvania alone. More than 15 million Americans in 11 states live within a mile of a fracked well. New York is the only state where municipal bans are legal. As methane is 20 times more radiatively active in the atmosphere than CO2, leaks of more than 3% from a well eliminate the greenhouse gas benefit that methane enjoys over emissions from coal.

 fracking traffic


 Key Quotes:

 “While it has long been known that vast reserves of natural gas (and oil) lay locked in layers of shale a mile or more underground, most of it remained inaccessible until this century, when the process of hydraulic fracturing — also known as fracking — was combined with horizontal drilling. "

“for the first time last year, natural gas contributed about the same level of greenhouse gas emissions as coal, the globe’s largest single source of greenhouse gas emissions driving climate change…Sixty-seven percent of natural gas produced in the U.S. came from fractured wells in 2015, according to the data. That represented a total of 53 billion cubic feet of natural gas per day, up from 50 billion cubic feet in 2014”

“because methane (the primary component of natural gas) is a greenhouse gas whose potency is more than twenty times that of CO2 over a hundred-year period, even a relatively small rate of methane leakage (i.e., 3 percent) from the production and distribution of shale gas could “offset or even reverse the entire apparent greenhouse gas benefit of fuel switching from coal to natural gas”

 “the proposed culprit in most reports of health impacts is air pollution, resulting from gas wells, compressor stations (which serve as nodes for area wells that pressurize the gas), and diesel engines venting volatile organic compounds — including known toxins such as benzene and formaldehyde — into the atmosphere next to residences, communal gathering places, and parks”

“more than 15 million Americans in eleven states live within one mile of a fracked well … approximately 700,000 acres of state forest are “available” for natural gas development… has approved 232 well pads (each capable of hosting up to twenty-four wells) and 1,020 shale gas wells since 2008”

 “It takes over one thousand truckloads just to deliver the water needed to frack one well, and a single well pad can host as many as eighteen to twenty-four gas wells”

“the tragedy of the commons engendered by private oil and gas leasing in rural communities works directly against the kind of collectivist politics needed to prevent our planet from lapsing into abrupt and irreversible climate change”

 “For shale gas extraction to be “sustainable,” it must do more than burn “cleaner” than coal: it should foster the resilience of common-pool resources and the communities that host it.”

Tuesday, June 28, 2016

How Does Early Action to Cut Carbon Emissions Reduce Impacts from Climate Change?

Differential climate impacts for policy-relevant limits to global warming: the case of 1.5 _C and 2 _C (25 page pdf,Carl-Friedrich Schleussner, Tabea K. Lissner, Erich M. Fischer, Jan Wohland, Mahé Perrette, Antonius Golly, Joeri Rogelj, Katelin Childers, Jacob Schewe, Katja Frieler, Matthias Mengel, William Hare, and Michiel Schaeffer, Earth System Dynamics, Apr. 21, 2016)

Also discussed here: 1.5°C vs 2°C: Why half a degree matters (Newsletter, International Institute for Applied Systems Analysis, Apr. 21, 2016)

Today we review research using scenarios with global climate models that show the difference in impacts from limiting global warming to 1.5 deg C or to 2.0 deg C by taking action to reduce carbon emissions and how quickly this is done. Many authoritative sources from COP 21 in Paris indicated that unless cuts of the order of 50% are taken within a decade (2025) that the 1.5 deg goal will be breached and unless the cuts reach 100% by 2050 that the 2 deg goal is probably unachievable. The paper examines the consequences of taking action too slowly or to a less than acceptable degree.

The impacts affect the length of heat waves (lasting 2 months more for 1.5C or 3 months for 2C), water availability, sea level rise, coral reefs and reduced crop yields. Perhaps the largest impact, sea level rise, has the largest implications because the processes involved in melting ice sheets are so large and slow moving. Once the Greenland ice sheet begins to breakdown, sea level rises of 5-7 m are inevitable over centuries with warming over 2C and will accelerate beyond 2100, while early action to limit warming to 1.5C would limit the sea level rise to 40 cm. Clearly policy makers at both the international and national/subnational levels need to step up to the challenge and soon. 2 deg climate impacts  

Key Quotes:

 “At the Paris Climate Summit the world decided to try to limit warming to below 1.5°C, in part because many considered climate impacts at 2°C to be too risky. Our new study provides essential new information about the risks under these two warming levels, and will feed into the ongoing international climate talks, helping policymakers deciding on the priority and urgency of climate action,”

“The additional 0.5°C would mean a 10-cm-higher global sea-level rise by 2100, longer heat waves, and greater risk of killing off tropical coral reefs.”

“On a global scale, the researchers anticipate sea level to rise about 50 cm by 2100 in a 2°C warmer world, 10 cm more than for 1.5°C warming. More importantly, however, is the rate at which sea level continues to rise in 2100. In a 1.5°C warmer world, this rate is about 30% lower than in a 2°C world, reducing our commitment to long-term sea-level rise. “

 “Substantial increases of 3 _C and more in TXx [hot extremes] over large parts of the Northern Hemisphere, central South America and South Africa as well as increases in warm-spell durations (WSDI) of 3 months and more are projected under a warming of 2 _C…The regional assessments indicate that the tropical regions in Africa, South America and South-East Asia are projected to experience the strongest increase in land area covered by heat extremes relative to the regional natural variability,”

“For a warming of 2 _C, reductions in water availability of up to 30% are projected in several – mainly subtropical – regions, in particular affecting the Mediterranean, South Africa, Central and southern South America and South Australia”

Thursday, June 23, 2016

What Are the Health Impacts from Urban Building Demolitions?

Ambient exposure to coarse and fine particle emissions from building demolition (Abstract, Farhad Azarmi & Prashant Kumar , Atmospheric Environment, Apr. 22, 2016)

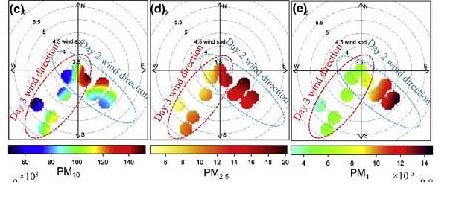
Today we review research into the dispersion of fine particles, including Aluminum(Al), silicate(Si) Zinc (Zn) and Magnesium (Mg), from a building demolition in London, UK, using a dispersion model that took into account windspeed and direction, decay over time and distance from the site. Demolition of buildings is expected to increase significantly, as a result of a 60% greater urban population over the next two decades, in addition to newer urban design forms and technologies.

The exposure to the particles noted above are linked to lung and kidney (renal) diseases, greater mortality and cardiovascular and Alzheimer diseases. Results indicate that concentrations of particulate matter (PM1, PM2.5 and PM 10) downwind of the demolition site is 4 to 11 times (respectively) greater than background levels, Males near or in the site inhale more dust than females and thus have a higher health risk. One could expect similar impacts from the digging of roads and construction of tunnels and ditches for Light and Heavy Rail Transit in large cities, currently in progress and planned for cities such as Toronto and Ottawa.

 demolition pm graph  

Key Quotes:

“Construction and demolition waste contribute up to about 33% of the total waste from all the streams; about half of which is demolition waste”

“This increased rate of building demolition could be linked to growing population of the urban areas and the need for improvements to meet new urban design guidelines and adopt building technologies ….the global urban population is expected to increase by about 60% in 2035 from the 2013 levels”

 “the RDD [respiratory deposited doses] of coarse and fine particles were found to be 58- and 5-times in the excavator vehicle cabin, respectively, which happens to be the highest exposure among all the assessed categories.”

“Exposure to Si have been linked with variety of adverse effects such as lung ..and renal … diseases; both of which have been found to result in increased rate of mortality... In addition, inhaling higher doses of Al have been associated with the cardiovascular … and Alzheimer’s .. diseases, besides leading to increased morbidity, particularly in older people.”
 “Since Si, Al and other elements such as Mg and Zn ..are integral part of inhaled particles, there is clearly an increased health risks at demolition sites.”

“The mass concentrations of average PM10, PM2.5 and PM1 were found to be about 11-, 3- and 4-times above the local background levels during fixed-site measurements at the downwind of the demolition site. The coarse particles (PM2.5e10) contributed majority(89%) of the total PMCs.”

 “The male subjects inhale more doses of particles than female subjects, because of their higher body tidal volume and breathing frequency and that the rate of deposited particles could considerably increase during heavy exercises by workers for the same emission source.”

Tuesday, April 5, 2016

Can We Reduce Carbon Emissions Enough to Meet Targets or Do We need Technology to Extract It Directly?

The suddenly urgent quest to remove carbon dioxide from the air (Chris Mooney, The Washington Post, Feb.26, 2016)

Also discussed here: Four ways to suck carbon out of thin air (Tim Meko, The Washington Post, Feb. 27, 2016)

Today we review an article that looks at the pros and cons of directly removing carbon from the air, in addition to the various plans to reduce emissions, which will be needed if the world is going to meet the goals (but not action plans) agreed to at the recent COP21 climate conference in Paris. Four approaches are described: Direct air capture, Bioenergy combined with carbon capture and storage, Afforestation and Enhanced weathering. While each can extract some carbon, the question remains if that is enough to meet the challenge which, in simple terms, means comparing the CO2 emissions of 17 tons/year/person (in the USA) with the extraction of a ton/day promised by technology. No question that something is needed in addition to the very modest targets that many countries are planning to reduce emissions at source. No surprise either that pricing carbon use is seen as essential. direct air capture  

Key Quotes:

 “the goals set at last year’s Paris accord on climate change, of keeping the planet’s warming “well below” 2 degrees Celsius, may not be achievable unless such technology comes to fruition.”

 “If you want to balance the books at this point, I don’t think you have a choice but to pull CO2 back that has already made it out…Or is about to make it out, because we are not overnight shutting down all the coal plants.”

“scientists have roughly calculated the remaining carbon “budget” for how much we can emit while still keeping below a 2-degree increase. And it’s extremely tight – well under 1,000 additional gigatons (or billion tons) of carbon dioxide. The world emits about 32 gigatons annually from energy use alone.”

Four ways to extract carbon from air:
  • Direct air capture …Carbon dioxide is pulled out of ambient air using absorptive substances that selectively bind to CO2. A company called Carbon Engineering uses fans to pull air across an absorbant membrane. There, CO2 is converted into a carbonate solution, which can be processed to trap the carbon.
  • Bioenergy combined with carbon capture and storage (BECCS)..Trees or other forms of biomass are burned in power plants and replanted. Power plants capture, compress and send carbon dioxide to sequestration sites, where it is buried or used for enhanced oil recovery.
  • Afforestation …Trees are planted in an area where a forest does not exist. Trees and vegetation consume carbon dioxide as they grow.
  • Enhanced weathering ..Slightly acidic rain falls on silicate rocks and they slowly break down to a carbonate solution. The carbon in the rain eventually winds up embedded in limestone rocks.
“I’m skeptical there is a technology that will cheaply capture CO2 at 400 parts per million when it’s expensive to do at 400,000 parts per million in a smokestack… It’s tougher thermodynamically. Carbon dioxide in air is a thousand times less abundant.”

 “simply planting huge amounts of trees where they currently do not exist, faces a similar hurdle. There’s no doubt more trees means less carbon dioxide in the atmosphere. Yet once again, vast areas could be required — and in the future, people will need even more land to grow food than at present.”

 “With all these technologies and ideas, then, the question becomes how to lower the cost and when the world will truly start investing. A boon to all of them, of course, would be setting a global (or for the U.S., national) price on carbon, thus making its removal more valuable.”