Showing posts with label plan. Show all posts

Tuesday, November 15, 2016

Must Cities Shrink to be Sustainable, even with Increased Urbanization?

Sustainability for Shrinking Cities (9 page pdf, Dustin L. Herrmann, William D. Shuster, Audrey L. Mayer and Ahjond S. Garmestani, Sustainability, Editorial, Sep. 7, 2016)  

Today we review an overview (and editorial) focused on sustainability for cities in the face of increasing urbanization worldwide and to the recent trend toward shrinking cities because of economic depression and the hollowing out of city centres as a result. Many large growing, economically-healthy cities tend to replace urban greenspace and urban parkland with high income residential or commercial developments with significant negative impacts on a healthy environment. Shrinking economically poor cities on the other hand are faced with vacant downtown lots some of which steer toward sustainable cities through improved water filtration, dampening of urban flash floods and carbon sequestration. For many coastal cities, sea level rise and threats to human health from more frequent hot spells as a result of climate warming are other issues on cities to adapt sustainably with more thoughtful urban planning.

shrinking-city  

Key Quotes:  

“Observations of past urban dynamics indicate that cities commonly undergo contraction phases …though there remains a need to identify what a sustainable trajectory is for shrinking cities.”

 “a shrinking city can be considered one with a smaller population or economy compared with its past; although, even a threshold of time may invoke an arbitrary designation. Any definition of a shrinking city is confounded with the fact that cities are composed of parcels, streets and neighborhoods that can have different growth and shrinkage trajectories than that of the city in the aggregate”

 “A general goal for the shrinking city was suggested…. as “aligning a city’s built environment with the needs of existing and future populations by adjusting the amount of land available for development”. “In the U.S., the second half of the 20th century was marked by the urban decline era…which saw population loss from the city core via rapid suburbanization, which was facilitated by federal government backing of highway construction.”

 “The shift in urbanization in favor of dense, and arguably traditional, urban neighborhoods can create the circumstances for stabilization in shrinking cities.”

“One significant difference between growing and shrinking cities is the proportion of green space providing ecosystem services which can help accomplish sustainable city goals .. Growing cities experience a net loss of green space, as there is high competition for space with other urban uses. Shrinking cities conversely are faced with an increasing extent of green space, typically in the form of vacant land.”

 “the emerging green space could provide ecosystem services such as water filtration and carbon sequestration, and given appropriate governance are a resource shrinking cities can use to transition to sustainable trajectories”

“For shrinking cities (e.g., Cleveland) that wish to slow decline and stabilize for sustainability, catalyzing change in infrastructure from gray to green infrastructure is a path to facilitate transformation"

 “the issue of legacy soil lead burden in vacant lands … offers a new framing of the problem by promoting human (learning and knowledge), social (urban gardening), and technical (soil testing as a data feedback) capitals to mitigate against soil lead availability, and leverage available natural resources toward urban agroecosystems that benefit local communities.”

 “sea level rise has many of the same outcomes shrinking cities experience through population loss, such as compromised infrastructure and new public health risks experienced by vulnerable populations.”

 “mid-size cities, shrinking or growing, are unique compared to large cities because they are more reliant on local ecosystem services. As such, a strategy for countering shrinking in mid-size cities may be acknowledging and leveraging this reliance for greater flexibility.”

Thursday, October 20, 2016

How Does a Low Carbon Future for Canada compare with Europe, the USA and Australia?

What low carbon futures might look like... (Ralph Torrie, Aug. 27, 2016)

Also discussed here: Low Carbon Energy Futures: A Review of National Scenarios (55 page pdf, Ralph D. Torrie, Tyler Bryant, Dale Marshall, Mitchell Beer, Blake Anderson, Ryan Kadowaki, and Johanne Whitmore, Technical Report, Trottier Energy Futures Project, Jan. 2013)

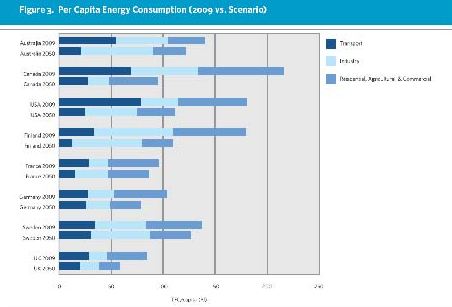
Today we review a report that compares low carbon future scenarios from 8 countries: 3 carbon resource rich (USA, Canada, Australia) and 5 European countries (Sweden Germany, France, Finland, UK). The common goal of the scenario was to lower carbon emissions by 80% from 1990 levels. Each country has its own approaches to the challenge from differing start points and so the scenarios differ as well although some similarities were noted including: decarbnization of the electricity supply, increased efficiency of fuels, a large supply of biofuels and electricity‘s share of the total energy consumption grows over time. Sweden has by far the lowest energy intensity because almost all of its electricity comes from nuclear, hydro and biomass- so that future reductions in carbon emissions comes from increased energy efficiency. Canada like Sweden also generates energy from non-carbon sources but has larger inputs ofnon-renewable energy sources (natural gas, coal, oil) in its energy pie and so has further to go to reach 80% less carbon emissions. Over 50% reductions in carbon emissions in Canada and the USA is in transportation where the growth of electric vehicles is key.

 energy-scenario  

Key Quotes:

“the TEFP objective is to chart a course for an 80 per cent reduction in Canada’s energy-related GHG emissions by 2050, using 1990 levels as a baseline.”

"present scenarios of how Canada could make the transition to a sustainable, low-carbon energy (emissions 80% below current levels) future through increased efficiency, greater reliance on renewable and low-carbon fuels and electricity, and changes in the way we use energy.”

“Eight recent low-carbon energy scenarios were selected for review by the Trottier Energy Futures Project to inform its effort to identify and analyze such scenarios for Canada. The criteria for inclusion in the review were that the scenario analyses be national in scope, comprehensive (covering all energy end uses), quantitative, long-term (to the year 2050), and focussed on deep reductions in greenhouse gas emissions (80 per cent below current levels).”

“the search for an 80 per cent emission reduction pathway (the magnitude of the response required to avoid what many scientists refer to as dangerous climate change) requires a deeper, broader strategy for transforming the energy system. When we add to that objective the caveat that emission reductions must also satisfy the imperatives of sustainability, the effort becomes even more challenging, and even more transformative.”

“Five pillars of low carbon future:
  • increased efficiency of fuel and electricity is paramount -- everything else depends on this,
  • electricity's share of energy end use increases (but not to 100%, not in this century),
  • the electricity supply is decarbonized,
  • a large and sustainable supply of biofuels is needed to hit the stretch targets in this century, and
  • we need to bend the baseline to achieve a lasting transition to a low carbon future.”
“Sweden has by far the lowest overall carbon intensity, at only 33 kg CO2e per GJ, reflecting the very high percentage of its electricity supply that comes from carbon-free sources—hydro, biomass, and nuclear power—as well as the high level of biomass use by industry, particularly pulp and paper.”

“Like Sweden, Canada generates a large share of its electricity supply from carbon-free sources, but Canada’s overall carbon intensity is still twice that of Sweden, reflecting much lower contributions from renewable sources and nuclear in the primary energy mix, as well as continued reliance on coal in some parts of the country.”

 “In the context of what an 80 per cent reduction in emissions might look like, it is interesting to note that the emissions intensities of the European nations, whether measured on a per capita or per GDP basis, are already 40 to 75 per cent below Canada’s. And yet, as discussed below, the scenario analyses for those same European countries reveal the possibility of reducing those emissions by 80 per cent or more, implying emission intensities by 2050 that are 90 to 95 per cent below current Canadian levels.”

“Much higher levels of energy efficiency, greater electrification of end uses, decarbonization of the electricity supply, and increased use of biomass are key drivers in all the low-carbon scenarios.”

“In the Canadian scenario included in our inter-country comparison, final energy demand is 55 per cent below the reference or “business as usual” case, due to energy efficiency improvements across all end uses and sectors. Final demand for heat drops by 40 per cent relative to the business-as-usual outlook, and specific energy use of industry drops by 70 per cent. Transport energy intensity drops by 55 per cent, and the share of electricity in meeting the final demand for transport grows from almost zero today to about 50 per cent by 2050.”

“The Australian scenario is drawn from the oldest of the studies we reviewed, completed in 2002. Efficiency improvements reduce final demand for energy in the industrial sector by 45 per cent, and in the commercial buildings sector by 55 per cent (building design and envelope improvements; more efficient lighting, and heating, ventilating, and air conditioning systems and equipment).”

“The United States scenario uses the U.S. EIA 2010 annual energy outlook, which already contains significant energy efficiency gains in its baseline. Counting both the gains in the EIA Annual Outlook and the additional assumptions in the U.S. low-carbon scenario, automobile efficiency increases by more than 50 per cent.”

Thursday, August 11, 2016

What Must Farmers do to Meet Emission Targets?

Reducing emissions from agriculture to meet the 2°C target (19 page pdf, E. Wollenberg, M. Richards, P. Smith, P. Havlík, M. Obersteiner, F.N. Tubiello, M. Herold, P. Gerber, S. Carter, A. Reisinger, D. van Vuuren, A. Dickie, H. Neufeldt, B.O. Sander, R. Wassmann, R. Sommer, J.E. Amonette, A. Falcucci, M. Herrero, C. Opio, R. Roman-Cuesta, E. Stehfest, H. Westhoek, I. Ortiz-Monasterio, T. Sapkota, M.C. Rufino, P.K. Thornton, L. Verchot, P.C. West, J.-F. Soussana, T. Baedeker, M. Sadler, S. Vermeulen, B.M. Campbell, Global Change Biology, May 17, 2016)

Also discussed here: New study sets climate target for agriculture (IIASA News, May 17, 2016) 

Today we review an assessment of approaches voluntarily proposed by 119 nations as Nationally Determined Contributions for COP21 in Paris to mitigate non CO2 emissions from the agricultural sector. Currently available approaches would deliver as little as 21% of the mitigation required to meet the 2 Deg C goal by 2030. The authors call for a range of innovative methods including carbon pricing, sequestering soil carbon and shifting dietary patterns and breeding cattle to produce less methane. Although agriculture is rural, some cities such as Ottawa, Canada contain more farmland (40% of rural area or 300,000 acres) and so must face up to the challenges in reducing greenhouse gases in this sector, as well as in transportation and the heating and cooling of buildings- and make this part of urban climate action plans.

 cattle emissions  

Key Quotes:

 “Agriculture (not including land use change) contributes an average of 35% of emissions in developing countries and 12% in developed countries today.”

“the agricultural sector must reduce non-CO2 emissions by 1 billion metric tons per year in 2030, a 17% reduction compared to the reference level projections of about 5.8 GtCO2eq…currently available interventions would only deliver between 21-40% of mitigation required as follows:
“Promising technical innovations on the horizon include recently developed methane inhibitors that reduce dairy cow emissions by 30% without affecting milk yields, breeds of cattle that produce lower methane, and varieties of cereal crops that release less nitrous oxide. ..more ambitious mitigation include introducing more rigorous carbon pricing, taxes and subsidies; … Focusing more attention on sequestering soil carbon, increasing agroforestry, decreasing food loss and waste and shifting dietary patterns “

 “international trade can bring a big potential for mitigation, by helping to encourage more production in the most efficient regions. However, without global targets for emissions reductions, decentralized approaches to climate mitigation could lead to inadequate pressure to decrease emissions from highly inefficient system such as those in Europe or North America”

Thursday, July 7, 2016

How Could the USA Become Carbon Neutral by 2050?

100% clean and renewable wind, water, and sunlight (WWS) all-sector energy roadmaps for the 50 United States (Abstract, Mark Z. Jacobson, Mark A. Delucchi, Guillaume Bazouin, Zack A. F. Bauer, Christa C. Heavey, Emma Fisher, Sean B. Morris, Diniana J.Y.Piekutowski, Taylor A. Vencill and Tim W.Yeskoo, Energy and Environmental Science, May 27, 2015

Also discussed here: Here's what it would take for the US to run on 100% renewable energy (David Roberts, Vox Energy and Environment, May 3, 2016)

Today we review a report that details how the USA could reach 100% renewable energy sources by 2050 and what cost and benefits would be needed to accomplish that. 80-85% of existing carbon energy sources would be replaced by 2030 and the rest by 2050 with 49% wind power, 45% solar power and the remainder hydroelectric, geothermal, tidal and wave power. Benefits include $7.1 trillion per year in avoided climate impact losses due to US emissions and $600 billion per year in avoided health costs. The approach includes more emphasis on public transit and safer walking and cycling, mandating battery electric vehicles for short and medium distance driving, an expansion in the number and distribution of electric charging sites as well as a time of use that favours night time charging, and electrification of freight rail.
jacobson-us-renewables-2015
Key Quotes:

“This study presents roadmaps for each of the 50 United States to convert their all-purpose energy systems (for electricity, transportation, heating/cooling, and industry) to ones powered entirely by wind, water, and sunlight (WWS). The plans contemplate 80–85% of existing energy replaced by 2030 and 100% replaced by 2050.”

 “Year 2050 end-use U.S. all-purpose load would be met with ∼30.9% onshore wind, ∼19.1% offshore wind, ∼30.7% utility-scale photovoltaics (PV), ∼7.2% rooftop PV, ∼7.3% concentrated solar power (CSP) with storage, ∼1.25% geothermal power, ∼0.37% wave power, ∼0.14% tidal power, and ∼3.01% hydroelectric power.”

“Converting would further eliminate ∼$3.3 (1.9–7.1) tril. per year in 2050 global warming costs to the world due to U.S. emissions.”

“These plans will result in each person in the U.S. in 2050 saving ∼$260 (190–320) per year in energy costs ($2013 dollars) and U.S. health and global climate costs per person decreasing by ∼$1500 (210–6000) per year and ∼$8300 (4700–17600) per year, respectively.”

“Switching from liquid fuels to renewable electricity would also virtually eliminate air pollution, thus avoiding health costs to the tune of $600 billion a year by 2050.”

 “ moving everything to carbon-free electricity would avoid about $3.3 trillion a year in global climate change costs of US emissions by 2050.

Tuesday, April 5, 2016

Can We Reduce Carbon Emissions Enough to Meet Targets or Do We need Technology to Extract It Directly?

The suddenly urgent quest to remove carbon dioxide from the air (Chris Mooney, The Washington Post, Feb.26, 2016)

Also discussed here: Four ways to suck carbon out of thin air (Tim Meko, The Washington Post, Feb. 27, 2016)

Today we review an article that looks at the pros and cons of directly removing carbon from the air, in addition to the various plans to reduce emissions, which will be needed if the world is going to meet the goals (but not action plans) agreed to at the recent COP21 climate conference in Paris. Four approaches are described: Direct air capture, Bioenergy combined with carbon capture and storage, Afforestation and Enhanced weathering. While each can extract some carbon, the question remains if that is enough to meet the challenge which, in simple terms, means comparing the CO2 emissions of 17 tons/year/person (in the USA) with the extraction of a ton/day promised by technology. No question that something is needed in addition to the very modest targets that many countries are planning to reduce emissions at source. No surprise either that pricing carbon use is seen as essential. direct air capture  

Key Quotes:

 “the goals set at last year’s Paris accord on climate change, of keeping the planet’s warming “well below” 2 degrees Celsius, may not be achievable unless such technology comes to fruition.”

 “If you want to balance the books at this point, I don’t think you have a choice but to pull CO2 back that has already made it out…Or is about to make it out, because we are not overnight shutting down all the coal plants.”

“scientists have roughly calculated the remaining carbon “budget” for how much we can emit while still keeping below a 2-degree increase. And it’s extremely tight – well under 1,000 additional gigatons (or billion tons) of carbon dioxide. The world emits about 32 gigatons annually from energy use alone.”

Four ways to extract carbon from air:
  • Direct air capture …Carbon dioxide is pulled out of ambient air using absorptive substances that selectively bind to CO2. A company called Carbon Engineering uses fans to pull air across an absorbant membrane. There, CO2 is converted into a carbonate solution, which can be processed to trap the carbon.
  • Bioenergy combined with carbon capture and storage (BECCS)..Trees or other forms of biomass are burned in power plants and replanted. Power plants capture, compress and send carbon dioxide to sequestration sites, where it is buried or used for enhanced oil recovery.
  • Afforestation …Trees are planted in an area where a forest does not exist. Trees and vegetation consume carbon dioxide as they grow.
  • Enhanced weathering ..Slightly acidic rain falls on silicate rocks and they slowly break down to a carbonate solution. The carbon in the rain eventually winds up embedded in limestone rocks.
“I’m skeptical there is a technology that will cheaply capture CO2 at 400 parts per million when it’s expensive to do at 400,000 parts per million in a smokestack… It’s tougher thermodynamically. Carbon dioxide in air is a thousand times less abundant.”

 “simply planting huge amounts of trees where they currently do not exist, faces a similar hurdle. There’s no doubt more trees means less carbon dioxide in the atmosphere. Yet once again, vast areas could be required — and in the future, people will need even more land to grow food than at present.”

 “With all these technologies and ideas, then, the question becomes how to lower the cost and when the world will truly start investing. A boon to all of them, of course, would be setting a global (or for the U.S., national) price on carbon, thus making its removal more valuable.”

Tuesday, December 15, 2015

How Does Urbanization Affect Urban Air Quality in China?

English: Population density in the People's Re...
English: Population density in the People's Republic of China (Photo credit: Wikipedia)
Estimating the Impact of Urbanization on Air Quality in China Using Spatial Regression Models (23 page pdf, Chuanglin Fang, Haimeng Liu, Guangdong Li , Dongqi Sun and Zhuang Miao, Sustainability, Nov. 20, 2015)

Today we review research into the main characteristics of close to 300 Chinese cities that affect the degree of urban air pollution. Results indicate a close relationship between population density and private cars per unit of developed urban land and that this and the proportion of secondary industry has the greatest effect on the pollution of most cities, especially in the North (in Beijing, Tianjin, Hebei, Henan, and Shandong). The authors recommend that China strictly control the scale of their mega cities and actively develop small and medium sized cities to offset these trends.

Key Quotes:

“Contributing to 1.2 million premature deaths in 2010 and 1.6 million premature deaths in 2014, ambient particulate matter pollution has become the fourth greatest risk factor in all deaths in China, behind only dietary risks, high blood pressure, and smoking…between 2000 and 2010, the economic cost of air quality degradation in China amounted to approximately 6.5% of Chinese GDP annually”

“The permanent urban population in China increased from 17.9% to a staggering 54.77% between 1978 to 2014; ten million people a year migrated from rural areas to China’s large cities during this period,”

“there were, on average, 73 days characterized by “unhealthy” or worse air quality (i.e., AQI > 150) in 70 major cities in 2014, and the dominant pollutants present were PM2.5, PM10, and O3.”

 “we collected air quality index (AQI) records and urbanization indexes for 289 Chinese cities, posing the following research questions…:
  1. What is the spatial pattern of China’s air pollution at the city level?
  2. How can we evaluate the comprehensive influence of urbanization and identify the impact of significant variables on air quality, quantitatively?
  3. To what extent does the spatial contribution made by various urbanization factors account for variations in AQI values? “
“The proportion of urban population thus played a more important role in the North China Plain.” “The spatial pattern of PPC coefficients was similar to those of UR[Demographic urbanization – population %] and the traffic factor was found to have the most important effect on air quality in the Bohai Bay Rim area. Further, both UR and PPC[Private cars per unit of urban development land] had a negative effect on AQI in some southwestern Chinese cities, and this might be related to their limited social and economic development, which is related to the retention of a natural environment that has not been affected by urbanization trends. “
 
“the population size of cities in the north of China had a greater impact on their AQI values than in the cities of the south. What is interesting is that the spatial distribution of PD[Population density (people/sq km)] coefficients displayed a pattern of longitudinal zonality. The impact of population density on air quality in eastern coastal China was thus found to be lower than that in western cities, although the population density of the eastern cities was in fact higher. "
  “Seriously polluted cities were found to be gathered closely together in Beijing, Tianjin, Hebei, Henan, and Shandong, which presented as hot spots on the visualizations.”

“Among the variables, the population, urbanization rate, automobile density, and the proportion of secondary industry were all found to have had a significant influence over air quality. “

"China must strictly control the scale of megacities and actively develop small and medium-sized cities.”

“Automobile density and the proportion of secondary industry has significant impacts in relation to AQI values: thus, on the one hand, China must promote intelligent traffic management, increase the proportion of green public transport and reasonably controlling the vehicle population in order to reduce emissions from transport; “

Tuesday, November 10, 2015

Six Principles to Implement Carbon Pricing Quickly, Fairly and Cost-Effectively

The FASTER Principles for Successful Carbon Pricing: An approach based on initial experience (49 page pdf, the Organisation for Economic Cooperation and Development (OECD) and the World Bank Group (WBG), Sep. 20, 2015)

Also discussed here: New Principles to Move on a Low Carbon Path, amid Growing Momentum for Carbon Pricing (Press Release, World Bank, Sep. 20, 2015)

 Today we review proposals from the World Bank and OECD to implement carbon pricing around the world based on experiences from 40 nations and 23 cities. Wider adoption by other countries has the potential to both reduce carbon emissions and to raise significant revenue that could accelerate emission reductions and climate adaptation: up to $400 B by 2030 and $2.2 trillion by 2050. FASTER  

Key Quotes:

“the FASTER principles:
  • fair; Successful carbon pricing policies reflect the“polluter pays” principle and contribute to distributing costs and benefits equitably,
  • aligned with other policies measures that facilitate competition and openness, ensure equal opportunities for low-carbon alternatives, and interact with a broader set of climate and non-climate policies.
  • stable and predictable, gives a consistent, credible, and strong investment signal, the intensity of which should increase over time.
  • transparent, Successful carbon pricing policies are clear in design and implementation.
  • efficient Successful carbon pricing improves economic efficiency and reduces the costs of emission reduction.
  • cost-effective and reliable Successful carbon pricing schemes result in a measurable reduction in environmentally harmful behavior.”
“40 nations and 23 cities, states or regions are using a carbon price. This represents the equivalent of about 7 billion tons of carbon dioxide, or 12 percent of annual global greenhouse gas emissions.”

“cooperation between countries, compared to domestic action alone, could significantly lower the cost of achieving a 2°C goal, … can result in up to $400 billion by 2030 and up to $2.2 trillion by 2050 in net annual flows of financial resources.”

“California and Québec, which together with British Columbia, Manitoba and Ontario, form part of the Western Climate Initiative (WCI), linked their emissions trading systems from January 1, 2014. Together, they form the largest carbon market in North America.”

 “British Columbia’s carbon tax design includes a tax credit for low-income households to offset the financial burden of more expensive fuel. The credit was last increased in 2011, when it rose to Can$115.50 per adult and Can$34.50 per child. A study found that low-income households were better off after 2010 because the Low Income Climate Action tax credit was more than the amount paid in carbon tax”

“Counterproductive policies undermine the environmental benefits of carbon pricing and should be scaled back….when domestic retail fuel prices are held down below international prices .. or when domestic prices are below cost-recovery prices (for electricity).. climate-harmful subsidies include those for company cars, parking, livestock production and crop production using fertilizers that release nitrogen oxides.”