Thursday, December 22, 2016

Does Air Pollution Affect the Stock Market?

The main trading room of the Tokyo Stock Excha...
The Effect of Air Pollution on Investor Behavior: Evidence from the S&P 500 (Abstract, Anthony Heyes, Matthew Neidell, Soodeh Saberian, National Bureau of Economic Research, Oct. 26, 2016)

Also discussed here: Why investors may want to keep tabs on air pollution (CBS News, Oct. 26, 2016) 


 Today we review several reports that look at the links, if any, between investment returns and short term changes in local air quality, as examined in the stock exchanges of the USA, Italy and China. There is some evidence that higher levels of fine particulate matter may reduce one day returns by almost 12%. Also, when the trading floor is near or within an area of higher air pollution, trading activity is affected.

Key Quotes:

“We hypothesize that pollution decreases the risk attitudes of investors via short-term changes in brain and/or physical health,”

“Unlike other common air pollutants -- which either remain outside or break down very rapidly once indoors -- going inside reduces one’s exposure to [fine particulate matter] only minimally…a one standard deviation increases in ambient PM2.5 reduces same-day returns by 11.9%”

“We find {USA] that air pollution is negatively related to stock returns, even when controlling for other variables. The relationship becomes weaker as the distance of the stock exchange from the polluted area increases.”

“we document the existence of an air pollution effect only when trading is conducted on the floor, which provides evidence in support of the view that the air pollution effect is at least partly mediated by the behavior of the trading floor community.”

“Our results [China] indicate that asset returns are unaffected by changes in mood introduced by factors including the weather and the onset and recovery from SAD… we show that in an order-driven market, environmental impacts on sentiment are likely to affect trading activities, but not returns.”

Tuesday, December 20, 2016

How Can The US Transportation Become Carbon Free by 2050?


Also discussed here: Report: Global Warming Solutions (Environment America Research & Policy Center, Oct. 24, 2016)

Today we review a report that recommends 50 steps aimed at state and federal program and policies that could make the USA’s transportation system carbon free by 2050. The steps include making carbon reduction strategies a key priority by exploiting the growth of electric vehicles, autonomous vehicles and the sharing of cars and bicycles, adding more effective public transit, employing smart pricing policies and phasing out carbon intensive vehicles and fuels.

 co2-emissions-by-country  
Key Quotes:

“Efficient electric vehicles that can be powered by clean, renewable electricity are entering the marketplace faster than the hybrid cars of a decade ago “

“An explosion of technology-enabled services – from carsharing to bikesharing to Lyft and Uber – has begun to revolutionize transportation in many cities. “

 “Public transportation reduces vehicle travel (and greenhouse gas emissions) by about 10 percent in U.S. cities, and cities across the country are considering bold plans to expand access to high-quality transit.”

“Cities around the world have shown that smart pricing policies can reduce congestion and encourage the use of low-carbon modes of travel.”

 “autonomous vehicles can be deployed in ways that can support efforts to reduce greenhouse gas emissions – especially if they facilitate the use of shared mobility services, vehicle electrification and smart pricing, and if public policy limits any increases in vehicle travel resulting from automation.”

 “Principles:
  • Climate concerns should inform every transportation policy decision…Only seven states have enforceable, economy-wide limits on carbon pollution, and, as of 2012, the vast majority of states and metropolitan planning organizations did not even consider greenhouse gas emissions in agency planning processes.
  • Low-carbon transportation should be at the front of the line for public funding … Between 1956 and 2014, 79 percent of all government capital expenditures on transportation went toward highways,
  • People should be rewarded for making low-carbon transportation choices….income tax exclusion for commuter parking subsidizes rush hour driving to the tune of more than $7 billion per year.
  • Carbon-intensive vehicles and fuels should be phased out…Federal policies have failed to tap the potential of lower-carbon fuels, with the federal Renewable Fuels Standard currently serving largely to encourage the use of corn ethanol
  • Public policy should encourage climate-friendly communities…some localities have begun to lift mandatory minimum parking requirements that add to the cost of new housing development and consume precious and limited urban space.
  • Public policy should foster innovation…Key state and federal policies hamper innovation by failing to account for changing circumstances such as the emergence of shared mobility services or growing demand for urban living, or by locking officials into spending or policy practices more attuned to the needs of a previous generation.”

Thursday, December 15, 2016

What Factors are Important for Coastal Cities Facing Sea-Level Rise - A Literature Review

Resilience of Infrastructure Systems to Sea-Level Rise in Coastal Areas: Impacts, Adaptation Measures, and Implementation Challenges (28 page pdf, Beatriz Azevedo de Almeida and Ali Mostafavi, Sustainability, Nov. 1, 2016)

Today we summarize a literature review of research papers examining the impacts of sea level rise on coastal areas of the world which include flooding, coastal erosion, land subsidence and saltwater intrusion. A rise of only ½ a meter in the next 50 years puts at risk 150 million people and $35 trillion of assets in 20 of the world’s most vulnerable port cities. Any success in reducing carbon emissions and the associated increase via climate change in temperature, precipitation and sea level rise would allow for 30% less impact on infrastructure systems such as power stations, oil and gas refineries and wastewater treatment plants.

 sea-level-rise-impacts  

Key Quotes:

 “Expansive areas of low elevation in many densely populated coastal areas are at elevated risk of storm surges and flooding due to torrential precipitation, as a result of sea level rise.”

“A 100-year storm surge, which is expected to begin occurring every 3–20 years, could cost billions of dollars in direct damages after 1 foot of sea-level rise”

 “Salt water intrusion into groundwater aquifers is one of the major impacts of sea-level rise.” “there are 136 major port cities with more than one million inhabitants each, 13 of which are among the top 20 most populated cities in the world.”

“Many of the world’s infrastructure facilities such as power generation facilities, refineries stations, water and wastewater treatment plants, and transportation networks are located along coastlines. As sea levels rise and coastlines erode, infrastructures are more exposed to the forces of nature and becoming structurally unstable.”

“groundwater inundation caused by sea level rise reduces the drainage capacity of storm water systems, and thus, could affect drainage and runoff infiltration…. during Hurricane Sandy in 2012, sewage backup led to the overflow of 11 billion gallons of raw sewage into the streets, rivers, and coastal waters”

“In the U.S., a great number of coastal energy facilities are located in areas exposed to 4 feet sea-level rise. An analysis …identified 287 energy facilities at risk of flooding, spreading throughout 22 coastal states. These facilities include natural gas infrastructures, electric power plants, and oil and gas refineries.”

Global climate models suggest that global average sea level might rise 18–59 cm by 2100, if ice sheets continue to melt at the rate observed from 1993 to 2003. If the rate increases at the same trend as global temperatures warm, total sea level rise by 2100 might be 10–20 cm greater than the average projections.”

Tuesday, December 13, 2016

How does Air Pollution and Noise from Road Traffic affect Blood Pressure?

Car owners request measures against traffic no...
 Car owners request measures against traffic noise for the road at their home, a typical Nimby (Not In My Backyard) situation (Photo credit: Wikipedia)

Long-term exposure to ambient air pollution and traffic noise and incident hypertension in seven cohorts of the European study of cohorts for air pollution effects (ESCAPE) (Abstract, Kateryna B Fuks, Gudrun Weinmayr, Xavier Basagaña, Olena Gruzieva, Regina Hampel, Bente Oftedal, Mette Sørensen, Kathrin Wolf, Geir Aamodt, Gunn Marit Aasvang, Inmaculada Aguilera, Thomas Becker, Rob Beelen, Bert Brunekreef, Barbara Caracciolo, Josef Cyrys, Roberto Elosua, Kirsten Thorup Eriksen, Maria Foraster, Laura Fratiglioni, Agneta Hilding, Danny Houthuijs, Michal Korek, Nino Künzli, Jaume Marrugat, Mark Nieuwenhuijsen, Claes-Göran Östenson, Johanna Penell, Göran Pershagen, Ole Raaschou-Nielsen, Wim Swart Jr, Annette Peters, Barbara Hoffmann, European Heart Journal, Oct. 24, 2016)


Today we review research based on the effects of traffic –related air pollution and noise in five countries for 5-9 years. Results indicate that the risk of high blood pressure or hypertension increased by 20% for those who live in more polluted areas (for every increase of 5 µg/m3 of PM2.5) and by 6% for those living in areas with a higher level of noise. Air pollution was higher in Germany and Spain than in Scandinavian countries and the combination of air and noise pollution was higher in Spain and Sweden.

Key Quotes: 

“Long-term exposure to air pollution is linked to a greater incidence of high blood pressure, according to the largest study to investigate the effects of both air pollution and traffic noise by following over 41,000 people in five different countries for five to nine years.” 

“among adults, up to one extra person per 100 people of the same age group living in the most polluted areas of cities would develop high blood pressure (hypertension) compared to those living in the less polluted areas…similar to the effect of being overweight with a body mass index (BMI) between 25-30 compared to people with normal weight” 

“for every five micrograms [2] per cubic metre (5 µg/m3) of PM2.5, the risk of hypertension increased by a fifth (22%) in people living in the most polluted areas compared to those in the least polluted areas” 

 “people living in noisy streets, where there were average night time noise levels of 50 decibels, had a six percent increased risk of developing hypertension compared to those living on quieter streets where average noise levels were 40 decibels during the night.” 

“there were higher average levels of pollution in the central and southern European study areas -- Germany and Spain -- than in the Scandinavian areas -- Norway, Sweden and Denmark. Exposure to traffic noise and traffic load was highest in the study areas of Sweden and Spain.”

Thursday, December 8, 2016

How Can Transportation in the USA Become Carbon Free by 2050?


Also discussed here: Report: Global Warming Solutions (Environment America Research & Policy Center, Oct. 24, 2016)

Today we review a report that recommends 50 steps aimed at state and federal program and policies that could make the USA’s transportation system carbon free by 2050. The steps include making carbon reduction strategies a key priority by exploiting the growth of electric vehicles, autonomous vehicles and the sharing of cars and bicycles, adding more effective public transit, employing smart pricing policies and phasing out carbon intensive vehicles and fuels. co2-emissions-by-country  

Key Quotes:

“Efficient electric vehicles that can be powered by clean, renewable electricity are entering the marketplace faster than the hybrid cars of a decade ago “

 “An explosion of technology-enabled services – from carsharing to bikesharing to Lyft and Uber – has begun to revolutionize transportation in many cities. “

Public transportation reduces vehicle travel (and greenhouse gas emissions) by about 10 percent in U.S. cities, and cities across the country are considering bold plans to expand access to high-quality transit.”

“Cities around the world have shown that smart pricing policies can reduce congestion and encourage the use of low-carbon modes of travel.”

 “autonomous vehicles can be deployed in ways that can support efforts to reduce greenhouse gas emissions – especially if they facilitate the use of shared mobility services, vehicle electrification and smart pricing, and if public policy limits any increases in vehicle travel resulting from automation.”

“Principles:
  • Climate concerns should inform every transportation policy decision…Only seven states have enforceable, economy-wide limits on carbon pollution, and, as of 2012, the vast majority of states and metropolitan planning organizations did not even consider greenhouse gas emissions in agency planning processes.
  • Low-carbon transportation should be at the front of the line for public funding … Between 1956 and 2014, 79 percent of all government capital expenditures on transportation went toward highways,
  • People should be rewarded for making low-carbon transportation choices….income tax exclusion for commuter parking subsidizes rush hour driving to the tune of more than $7 billion per year.
  • Carbon-intensive vehicles and fuels should be phased out…Federal policies have failed to tap the potential of lower-carbon fuels, with the federal Renewable Fuels Standard currently serving largely to encourage the use of corn ethanol
  • Public policy should encourage climate-friendly communities…some localities have begun to lift mandatory minimum parking requirements that add to the cost of new housing development and consume precious and limited urban space.
  • Public policy should foster innovation…Key state and federal policies hamper innovation by failing to account for changing circumstances such as the emergence of shared mobility services or growing demand for urban living, or by locking officials into spending or policy practices more attuned to the needs of a previous generation.”

Tuesday, December 6, 2016

What Happens to Coastal Cities Vulnerable to Sea Level Rise?

Adapting to rates versus amounts of climate change: a case of adaptation to sea-level rise ( 9 page pdf, Soheil Shayegh, Juan Moreno-Cruz and Ken Caldeira, Environmental Research Letters, Oct. 4, 2016)

Today we review the most immediate aspect of climate change- its impact in terms of sea level rise and how best to adapt to this financially, given that many coastal cities are threatened including London, New York, and Tokyo. The authors consider four scenarios given the current rate of rise of 44 cm/100 years which is expected to increase by almost a factor of ten to 344 cm/100 years as Antarctic ice continues to melt over the next 1,000 years for a 60 m rise in sea level. The scenarios include: taking no action, creating a buffer zone, adapting to change in rise and building dikes to withstand increased sea levels. The optimum distance from the sea for safety increases from 310 m to 481 m as the rate of rise of sea level doubles. Insurance based on static risk need to be revised to a more flexible approach based on rate of rise.

 aea-level-riase-and-adaptation  
Key Quotes:

“climate is likely to continue changing far into the future. Here, we show how considering rates of change affects the projected optimal adaptation strategy.”

“Recent studies indicate that sea-level may continue to rise for millennia, ultimately leading to up to 60mof sea-level rise” “optimal investment strategies depends on taking into account future rates of sea level rise, as well as social and political constraints….Unrestrained fossil-fuel combustion with release of CO2 to the atmosphere has the potential to ultimately melt all of Antarctica at rates of sea-level rise averaging up to 3 cmyr−1 over the next 1000 years “

“Over the next 1000 years, sea-level is projected to rise at an average rate of 3.44 cm yr−1, if all available fossil fuel resources are combusted and the CO2 released to the atmosphere”

 “In the scenarios where rate of change is taken into account …, the optimal distance from the shoreline for investment increases from 310 to 481m as the rate of sea-level is doubled from 1 to 2 cm yr“

 “Failure to recognize the need for adapting to the rate of climate change undervalues the benefits of early adaptation strategies and increases vulnerability to climate change.”

Flood insurance policies traditionally estimate the likelihood of a flood by assigning a probability to such event. New insurance policies can be designed by taking into account the ongoing rate of sea-level and updating the flood likelihood.”

Thursday, December 1, 2016

How do Travel Demand and Economics Affect the Development of Urban Road Networks?

A Model of the Rise and Fall of Roads (33 page pdf, Zhang, Lei, Levinson, David M, Systems Symposium at the Massachusetts Institute of Technology, Mar. 2004)

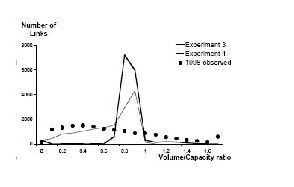
Today we review a seminal paper from over a decade ago that examines the dynamics of road development in a major mid-West American city (Minneapolis-Saint Paul) using a model that combines measures such as travel demand statistics (usually found on Origin Destination studies) with the economics of road pricing or tolls, geographical constraints (such as rivers and mountains) and how these change with newer technology over time (in this case over 20 years). Roads represent both figuratively and physically the link that join the issues addressed in this blog: how traffic is linked to pollution and how pollution is linked to health. Of particular interest is the way that travel demand and road volume capacity (VC) interact with road tolls and the cost of road construction and the resulting revenue that may be used to ease congestion, in addition to the overall design of the road network and design for a major urban area. road-links  

Key Quotes:

 “In 1900 there were 240 km of paved road in the United States … and this total had increased to 6,400,000 by 2000 …with virtually 100% of the U.S. population having almost immediate access to paved roadways.”

“questions yet to be answered: (1) How do the existing links (roads) develop and degenerate? (2) How are new links added to the existing network? (3) How are new nodes added to the existing network?” “the Twin Cities transportation network which comprises nearly 8,000 nodes and more than 20,000 links, using network data collected since year 1978”

Specific questions on the rise and falls of roads:
  1. “Why do links expand and contract?
  2. Do networks self-organize into hierarchies?
  3. Are roads (routes) an emergent property of networks?
  4. What are the parameters to be calibrated in a microscopic network dynamics model?
  5. Is the model computationally feasible on a realistic transportation network?
  6. Is the model capable of replicating real-world network dynamics?”
economic growth is a two-way interaction between the economy and technology; technological research transforms the economy that finances it.. transportation investment drives the growth that funds it.” “In developed countries where transportation infrastructure has reached its saturated stage, it is rare to see new network growth from a tabula rasa. Even in an empty place without any previous developments, natural barriers such as rivers and mountains still impose constraints on future network growth.”

“Longer, faster, and high-demand (traffic flow) links should be able to generate more revenues. If not maintained appropriately, link LOS [Level of Service] will decrease over time due to physical deterioration caused by the environment and traffic.”

“link expansion cost is positively correlated to lane-miles of expansion and road hierarchy (interstate, state highway, county highway, etc.), while negatively related to the distance from the nearest downtown” “most roads carry flows well below their capacity and a few roads operate at VC [volume capacity] ratios near or slightly higher than one. Practically, over a long period of time, no road can carry flows more than its capacity.”

 “some important system properties, such as road hierarchies and self-organization in transportation networks, can be predicted through a microscopic evolutionary process, a demonstration that such a microscopic agent-based model of network dynamics can be feasibly applied to large-scale realistic transportation networks, and an enquiry into how this concept can be realized and produce useful modeling tools for planners.”