Thursday, August 18, 2011

Reaching Climate Stabilization by Reducing Non-CO2 emissions

Non-CO2 greenhouse gases and climate change (Abstract, S. A. Montzka, E. J. Dlugokencky & J. H. Butler, Nature 476, 43–50, Aug.4, 2011)

Also discussed here: Slowing Climate Change by Targeting Gases Other Than Carbon Dioxide (Science Daily, Aug. 3, 2011)

Stabilizing climate change requires reducing emissions from carbon fuels alone by almost 100% and it is clear that even if the world found a way of doing this that it would not be achieved in a century or more- far too long to avoid the impacts from a changing atmosphere. The article reviewed today examines the non carbon gas emissions which have much shorter lifetimes in the atmosphere , contribute significantly to climate change and therefore represent an opportunity to reach stabilization more quickly than through CO2 emission reductions alone.


Key Quotes:

“stabilizing the warming effect of CO2 in the atmosphere would require a decrease of about 80 percent in human-caused CO2 emissions -- in part because some of the carbon dioxide emitted today will remain in the atmosphere for thousands of years”

“ In contrast, cutting all long-lived non-CO2 greenhouse gas emissions by 80 percent could diminish their climate warming effect substantially within a couple of decades”

“ lowering emissions of greenhouse gases other than carbon dioxide could lead to some rapid changes for the better."

“Without substantial changes to human behavior, emissions of the non-CO2 greenhouse gases are expected to continue to increase”

“The non-CO2 gases studied have natural sources as well as human emissions, and climate change could amplify or dampen some of those natural processes”

“"The long-term necessity of cutting carbon dioxide emissions shouldn't diminish the effectiveness of short-term action”
Enhanced by Zemanta

Wednesday, August 17, 2011

Deciding on When and How to Toll Roads

Big Numbers Win Prizes (Robert Bain, Apr. 8, 2009)

Also discussed here: Toll Road Traffic & Revenue Forecasts: An Interpreter's Guide (R. Bain, 2009)

And here: The Credit Dynamics of Congestion Charging (Bain R and Plantagie JW, Standards & Poor’s, Nov. 2003)

Making the decision to begin tolling and then choosing which way to toll is a challenge that many municipalities and countries face today. Today’s review article looks at 21 ways that toll revenue and traffic are exaggerated or incorrectly estimated- and suggests ways to approach the topic in more objective and rationale ways, in order to decide on the optimum choice.


Key Quotes:

“market readiness to be seduced by hopelessly optimistic traffic and revenue projections.. The evaluation criteria used to award many of today's toll road concessions focus on maximising income – or minimising expenditure – for promoters.. the procurement process in .. reward high traffic and revenue forecasts, not accurate ones”

“The list of 21 ways in which toll road traffic and revenue forecasts can be inflated is not exhaustive. It is purely indicative“

“Traffic modellers commonly employ assumptions about how the capacity of a toll facility will increase in future years despite its geometry and configuration remaining unchanged”

“Some toll road forecasts are made against a backdrop of strong historical traffic growth trends. Why should such trends continue unabated for the next 25–30 years or beyond?”

“Traffic surveys should be conducted on neutral days and during neutral months of the year“

“The value of travel time savings (VTTS) is a central concept in toll road demand studies.. The underlying theory suggests that disposable income will grow – in real terms – in the future and hence the value attributed to time savings should also grow”

“the driver who values a time saving of one hour at US$20 automatically values a saving of three minutes at US$1.. Researchers suggest that small amounts of saved time are inherently less useful than large amounts – particularly if you cannot do anything with the time saved”

“By using electronic toll collection (ETC) technologies, drivers do not have to pay the toll at the time/point of use. The charge is made to their credit card account and they are billed, in arrears, on a monthly basis. It is suggested that this encourages toll road usage above and beyond what would be expected from a cash-only operation”
Enhanced by Zemanta

Tuesday, August 16, 2011

What is the Better Indicator of Health Impacts from Particles- Black Carbon or PM?

Carbon blackBlack carbon as an Additional Indicator of the Adverse Health Effects of Airborne Particles Compared to PM10 and PM2.5 (44 page pdf, Nicole AH Janssen, Gerard Hoek, Milena Simic-Lawson, Paul Fischer, Leendert van Bree, Harry ten Brink, Menno Keuken, Richard W Atkinson, H Ross Anderson, Bert Brunekreef, Flemming R Cassee, Environmental Health Perspectives, Aug. 2, 2011)

Particulate Matter (PM) has long been used as a basis for indicating health impacts from vehilc emissions. In the report reviewed today, another indicator, Black Carbon (BCP), was found to have a greater sensitivity to proximity to roads and on mortality and is being recommended as an additional pollutant standard.


Key Quotes:

“Current air quality standards for particulate matter use the PM mass concentration (PM10 or PM2.5) as a metric…In this paper we evaluate the value of BCP as an indicator of the adverse health effects of combustion particles in addition to PM mass”

Combustion-related particles are thought to be more harmful to health than PM that is not generated by combustion..In urban areas, road traffic is a major source of combustion PM…Combustion particles also derive from a variety of sources other than motorized road traffic including wood and coal burning, shipping, and industrial sources”

“NO2 is not a suitable indicator to evaluate the effect of traffic abatement measures on exposure to combustion particles because some abatement measures, such as filters on diesel fueled vehicles, may increase NO2 levels”

“On average, BCP concentrations near busy roads were twice as high as urban background BCP concentrations, whereas PM concentrations near busy roads were only about 20% higher than background levels

“Single-pollutant effect estimates for daily mortality or hospital admissions generally were an order of magnitude higher for BCP compared to PM10 and PM2.5 when expressed per Eg/m3”

“BS levels on rural and urban locations in the Netherlands were about 50% higher on weekdays compared to Sundays, whereas BS concentrations at urban traffic locations were about 100% higher on weekdays compared to Sundays”

“In a modeling study of the effect of a speed limit reduction (from 120 to 90 km/hour) on air quality in Flanders, EC concentrations decreased up to 30% just next to the busiest highways, compared to an estimated reduction of at most 8.5% for PM2.5”
Enhanced by Zemanta

Monday, August 15, 2011

Vehicle Emissions in Chinese Cities

Beijing air on a day after rain (left) and a c...Image via WikipediaPoor air quality hits many big cities (Li Jing, China Daily, Aug. 2, 2011)

Also discussed here: Ministry of Environmental Protection, The People’s Republic of China

Today the focus is on the state of air quality in China’s cities, 40% of which are rated “poor” according to the Ministry of Environmental Protection. The main source of the pollution, as in major cities elsewhere, is vehicle emissions which have intensified in China in the last decade or two with the increase of vehicles and population.

Key Quotes:

“The average air quality in 45 major cities - nearly four out of every 10 major cities in the country - was rated as "poor" in the first half of this year”

Urumqi, capital of Northwest China's Xinjiang Uygur autonomous region, recorded the highest level of pollution”

Air quality in Beijing was also rated as poor due to the large amount of vehicle emissions, as there are more than 4.9 million cars in the capital.. Beijing discharged 1.9 percent more nitrogen dioxide in the first six months this year”

“26 cities will pilot new air quality monitoring and appraisal systems for air quality, which include total suspended particulates and the concentration of lead in the atmosphere”
Enhanced by Zemanta

Friday, August 12, 2011

Monitoring Local Pollution Across Canada

Creating National Air Pollution Models for Population Exposure Assessment in Canada (7 Page pdf, Perry Hystad, Eleanor Setton, Alejandro Cervantes, Karla Poplawski, Steeve Deschenes, Michael Brauer, Aaron van Donkelaar, Lok Lamsal, Randall Martin, Michael Jerrett, and Paul Demers, Environmental Health Perspectives, volume 119, number 8, August 2011)

Also discussed here: A Pollution Model Upgrade? Incorporating the Local Scale in National Models (1 page pdf, Environmental Health Perspectives, volume 119, number 8, Aug. 2, 2011)

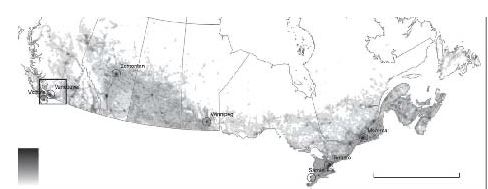
Today’s focus is on a study of how well the national air pollution network, supplemented by satellite data and regional land use regression modeling, can estimate local variability in 7 Canadian cities. Modelling improved the prediction of variability of NO2 from 18% using standard interpolation to 43% with supplemental data and techniques.


NO2 model (0-105 ug/m3) 0 1,000 km (1 km resolution)

Key Quotes:

“Fixed-site monitors may not capture entire populations, and measurements typically represent regional and between-city pollution differences due to monitor siting criteria, which prevent monitors from being placed in proximity to major roads and other pollution sources…Currently, the resolution of satellite data limits their use to representing regional pollution concentrations”

“The researchers assembled readily available data from the National Air Pollution Surveillance monitoring network in Canada and devised models to predict ambient concentrations of five pollutants at a national scale while capturing within-city pollution variability …Ground-level NO2 concentrations were estimated from tropospheric NO2 columns retrieved from the ozone monitoring instrument on the Aura satellite. Both PM2.5 and NO2 were estimated at a 0.1 × 0.1° resolution (~ 10 × 10 km)”

“To address the lack of local-scale geographic variability in the NAPS data, we incorporated deterministic gradients based on proximity to specific sources (i.e., vehicles and gas stations)”

“The NO2 model predicted 43% of the variability in readings predicted by LUR [Land Use Regression] models, compared with 18% using the common technique of simply interpolating between monitors using factors such as distance from the monitor, weather patterns, and known pollution sources”

“Predictions from the five models were influenced most strongly by satellite data for PM2.5 and NO2, vehicle emissions (represented by road type and location), industry emissions (from large point sources), and population density”

“The national pollutant models were applied to street block-face points, representing the locations of the Canadian population, to determine population exposure estimates. Estimates of average population exposure levels in Canada are PM2.5 8.39, NO2 23.37, benzene 1.04, ethylbenzene 0.63, and 1,3-butadiene 0.09 (µg/m3)”
Enhanced by Zemanta

Thursday, August 11, 2011

Managing Hot Spots in Urban Municipalities in England

Department for Environment, Food and Rural AffairsImage via WikipediaMapping Air Quality Action Plan Guidance available to Local Authorities (52 page pdf, prepared by Entec UK Limited for DEFRA, Apr. 14, 2011)

Also discussed here: Local Air Quality Management Webpage

Since legislation was enacted in 1995 to improve urban air quality in the UK, over 200 local authorities have declared over 500 Air Quality Management Areas (AQMA). The report reviewed today critically reviews the effectiveness of the guidance provided to the local authorities, identifies some shortcomings and makes recommendations. The lack of progress in reducing roadside emissions is notable.

Key Quotes:

“The Local Air Quality Management (LAQM) regime was thought to be effective at identifying areas where the Air Quality Objectives (AQOs) were likely to be exceeded”

“216 local authorities have declared 529 AQMAs. Some local authorities have declared the whole of their administrative areas as an AQMA, whereas others have declared AQMAs where “hot spots” of poor air quality occur within their area”

Road traffic emissions are the main contributor to current and forecast exceedences of the AQOs..Roadside concentrations of NO2 in particular have shown only a very small downward trend, and more recently there have been increases at some roadside locations in England.”

“[Some Identified Shortcomings And Comments] Diesel vehicles seem to have most effect on air quality in urban areas, but no measures to tackle this. Euro Emission Standards which should have resulted in improvements don’t seem to be materialising… Only really effective way of improving air quality is to reduce the number of vehicles on the roads. No clear measures about how to do this.. GIS Tool to highlight air quality hot spots and where there may be creeping air quality levels in areas in order to see visually where issues are located to try and address problems - Could be good tool for public to see issues also”

Some Recommendations:
  • “Local Authorities prefer to use best-practice examples when looking for ideas for measures to include within their Action Plans, especially where a measure has been effective elsewhere, in improving air quality. These examples will need to be easily accessible and updated regularly to show the use and effectiveness of new measures”
  • “Guidance for local authorities in order to raise awareness of air quality amongst members of the public and local councillors in relation to air quality and its synergies with planning, transport, climate change and its effects on health of local residents”
Enhanced by Zemanta

Wednesday, August 10, 2011

Car Dependency and Exclusion from Social Mobility

Social exclusion, DiscriminationImage via WikipediaTransport & Social Exclusion - A survey of the Group of Seven nations (44 page pdf, Summary Report, Editor: Dr Karen Lucas, Transport Studies Group, University of Westminster, the FIA Foundation, Feb. 2004)

Also discussed here: Social inclusion as a transport planning issue in Canada: Contribution to the FIA Foundation G7 Comparison (31 page pdf, Todd Litman, Victoria Transport Policy Institute, Apr.4, 2003)

And here: Transport and Social Exclusion - A United States View (29 page Word doc, L. Kennedy, Experts' Seminar, University of Westminster, the FIA Foundation, London, UK, Apr.4, 2003)

Today’s focus is on the many ways that the mobility needs of the poor and disadvantaged are met (or not) in G7 nations. The review article compares the extent of car dependency and the extent to which national transportation policies affect this mobility with large differences between North America on the one hand and Europe on the other. One factor is the degree of sprawl and large distances in Canada and the USA, as well as the greater access to alternative modes such as public transit in Europe and Japan. Value pricing (and congestion charging and road pricing) is being explored in the US (less so in Canada) to partly overcome this.


Key Quotes:

“About 20% of Canadian households do not own an automobile, about 10% are low-income, and about 10% of the population has a disability that constrains mobility”

“Automobile ownership is approaching saturation (a vehicle for each driver), particularly for non-poor households living outside of a few large cities (New York, Montreal, Toronto and Ottawa)”

“[in Canada] the average rural resident lives 10 kilometers from a physician, compared with 2 kilometers for urban residents, and that 7% of rural residents live 25 kilometers or more from a physician”

“Canada has no standard process for collecting national transport data, a consequence of the near-absence of a direct federal role in roadway planning and investment”

“Americans travel almost one hundred times more by automobile than by transit, yet the US spends less than four times as much on highways as transit. The US population grew 50 percent and US jobs doubled, and urban driving increased 420 percent since 1960. Yet, commuters riding transit to work decreased from 7.8 million to 6.1 million since 1960”

“Federal support was continued for pricing initiatives creating the Value-Pricing Pilot Program in the Transportation Equity Act for the 21st Century (TEA-21)…The projects involve HOV (High Occupancy Vehicle) lanes, toll roads, reversible HOV lanes, express passes, variable pricing and other alternatives”

“On the link between transport and social exclusion:

- access to a car.. seems to be essential to full participation in economic and social life in modern industrialised societies;

“On the public policy response in the Group of Seven:
  • the United Kingdom seems to be alone in attempting to make connections between poor transport amongst low income groups and other inequalities ..
  • in Canada, despite strong social programmes, there is little national effort to co-ordinate local transport planning or address transport related social exclusion problems;
  • Germany, Japan and Italy have developed specific policies to address mobility problems of disabled, older mobility impaired and isolated populations..”
Enhanced by Zemanta