Showing posts with label monitors. Show all posts

Tuesday, May 10, 2016

What is the Local Environmental Impact of Fracking?

Investigating the traffic-related environmental impacts of hydraulic-fracturing (fracking) operations (13 page pdf, Paul S. Goodman, Fabio Galatioto, Neil Thorpe, Anil K. Namdeo, Richard J. Davies, Roger N. Bird, Environment International, Feb. 1, 2016)

Today we review an aspect of fracking, not often investigated: the impact of local fracking wells which is a combination of the air pollution emissions from the fracking itself and the removal of waste water by tanker trucks which adds vehicle emissions and noise. There is a requirement for 9,000 to 29,000 cubic metres per well, or 54,000 to 174,000 cubic metres for a six-well pad. Total CO2 emissions associated with extraction of shale gas from a well were small (0.2–2.9%) compared to the combustion of the gas from the well. Modelling of NOx emissions showed increases reaching 30% over non-fracking periods and noise levels doubling.

  fracking traffic  

Key Quotes:

 “relatively high population densities in many countries and the potential negative environmental impacts that may be associated with fracking operations has stimulated …significant public debate regarding if and where fracking should be permitted. Road traffic generated by fracking operations is one possible source of environmental impact whose significance has, until now, been largely neglected in the available literature.”

“the local impacts of a single well pad may be short duration but large magnitude… whilst single digit percentile increases in emissions of CO2, NOx and PM are estimated for the period from start of construction to pad completion.. excess emissions of NOx on individual days of peak activity can reach 30% over baseline”

 “A production well pad could include 12 or more wells, which may be re-fracked several times, once production has declined. It subsequently becomes necessary to remove flowback water from those sites both during and after fracturing. If this transportation is done by road, as has typically been the case in the US and Canada, then considerable volumes of HDV (i.e. tanker) traffic may be generated, albeit for relatively short periods (i.e. weeks) of time. “

"The production of CO2 from traffic emissions due to shale gas exploitation has been previously examined …with on-road emissions estimated at 38 t–59 t CO2 per well… total CO2 emissions associated with extraction of shale gas from a well were small (0.2–2.9%) compared to total emissions from combustion of the gas produced by the well”

“each stage of a fracking operation for a single well will require between 1100 and 2200 m3 of water, leading to a total demand of 9000 to 29000 m3 per well, or 54,000 to 174,000 m3 for a six-well pad.”

“Total daily NOx emissions increase by 18%–20% (low scenario), and 27%–30% (high scenario) depending on access policy…the best policy for diurnal total emissions is overnight access, which creates negligible conflict with baseline traffic, though the relative emissions in the overnight period increase by a factor of 2–2.6.”

"Modelling of NOx emissions showed increases reaching 30% over non-fracking periods and noise levels doubling (+3.4 dBA), dependent on access policy implemented to the site, potentially exacerbating existing environmental issues.”

Tuesday, December 29, 2015

Finding New Urban Geothermal Energy Heating Sources from Satellites

Linking Surface Urban Heat Islands with Groundwater Temperatures (Abstract, Susanne A. Benz, Peter Bayer, Frank M. Goettsche, Folke S. Olesen, and Philipp Blum, Environ. Sci. Technol., Nov. 23, 2015)

Also discussed here: Satellites find sustainable energy in cities (Science Daily, Dec. 18, 2015)

Today we review research that bridges the well studied, (above ground) urban heat island with the urban ground water using satellite-derived temperatures and urban characteristics, such as population density and the number of cellars found in many older cities. This approach tested in Germany, found a spatial correlation of up to 80 % between the above and below ground heat islands and offers the potential of maximizing the potential for using warmer ground water in cities as an energy source for different cities over a large area. This in turn would help to ease the use of carbon fuels otherwise needed to warm urban buildings in winter.

 satellites geothermal cities  

Key Quotes:

“Temperature anomalies may contribute to regional air pollution and an increased mortality during hot spells in summer. Increased groundwater temperatures influence underground ecosystems and may favor growth of pathogens in groundwater.”

“Energy from close-to-surface groundwater aquifers may be used for heating in winter and cooling in summer with the help of geothermal or groundwater heat pumps. If this geothermal potential would be used, part of the growing energy consumption of cities might be covered. This would reduce emission of greenhouse gases and, thus, counteract global warming"

“Surface and underground heat islands are connected mainly by thermal conduction. So far, research has studied the individual heat islands separately from each other, such that little is known about interactions and relationships between above-ground and underground temperatures” “The researchers of KIT [Karlsruhe Institute of Technology.] and ETH compared above-ground and underground heat islands in the four cities of Berlin, Munich, Cologne, and Karlsruhe. They found a spatial correlation of up to 80%”

“satellite-measured surface temperature alone is not sufficient to reliably estimate groundwater temperature. For this reason, the scientists also considered population density and cellar temperature.”

Wednesday, July 9, 2014

Do We Need to Monitor Global Greenhouse Gases Emissions from Space?

Orbiting Carbon Observatory (OCO) (NASA, Jet Propulsion Laboratory)

Also discussed here: CO2 Monitoring Could Be “Space-Based” in Future (Bobby Magill, Climate Central, May 29, 2014)

And here: Multiscale observations of CO2, 13CO2, and pollutants at Four Corners for emission verification and attribution (6 page pdf, Rodica Lindenmaier, Manvendra K. Dubey, Bradley G. Henderson, Zachary T. Butterfield, Jay R. Herman, Thom Rahn and Sang-Hyun Lee,Proceedings of the National Academy of Sciences (PNAS), May 19, 2014)

And here: The President’s Climate Action Plan (White House, USA, Jun. 2013)

And here: Carbon Pollution Emission Guidelines for Existing Stationary Sources: Electric Utility Generating Units (645 page pdf, Environmental Protection Agency, USA, Jun. 2, 2014)

Today we review progress toward monitoring CO2 for the entire earth from a space-based platform, an approach that began in 2001 using the SCIAMACHY imaging spectrometer on the ENVISAT European satellite. In developed countries such as the USA, China or Canada, the main sources of CO2are either large coal or natural gas-burning plants or the emissions from heating/cooling building and vehicle emissions in urban areas which collectively contribute 80% of each countries emissions. Monitoring these emissions from the point sources is a complicated and time consuming task.

Recent research indicated that space based estimates of the CO2 found in columns extended to the earth’s surface compare well with ground based measurements. Plans to launch an improved sensor, the Orbiting Carbon Observatory (OCO) on July 1, 2014, combined with the commitment by the United States to reduce CO2 emissions from coal plants and other point sources and the need to monitor emissions globally validates the requirement for better space based estimates which are more efficiently collected and probably more accurate than the accumulated ground-based estimates.

  OCO_column  

Key Quotes:

“There is a pressing need to verify air pollutant and greenhouse gas emissions from= anthropogenic fossil energy sources to enforce current and future regulations. We demonstrate the feasibility of using simultaneous remote sensing observations of column abundances of CO2, CO, and NO2 to inform and verify emission inventories.”

“Under the Clean Air Act, in the United States these emissions are considered a threat to public health and welfare and are regulated by the Environmental Protection Agency (EPA).”

 “Nationwide, by 2030, this rule would achieve CO2 emission reductions from the power sector of approximately 30 percent from CO2 emission levels in 2005…the significant reductions in the harmful carbon pollution and in other air pollution, to which this rule would lead, would result in net climate and health benefits of $48 billion to $82 billion.”

“current reporting in non-US countries is based on bottom–up estimates that use the type of fuel burned, power plant thermal efficiency, and CO2 conversion factors, rather than direct measurements of CO2 emissions.”

“Our high-frequency and precision ground based remote-sensing results provide the performance metric and sampling strategy for satellite-based measurements, permitting a global emission monitoring system…Our findings offer promise for future satellite-based monitoring approaches that simultaneously measure column CO2 and NO2 and determine emission factors from space.”

 “To fully exploit this capability, we need to acquire measurements like this at high spatial resolution over the entire globe… One way to do this (is) to collect remote sensing observations from sensors deployed on space-based platforms. We have started down this road and we are making good progress.”

“coal accounts for 70 percent of energy used in China today, primarily for electricity production, and its coal use is increasing…Chinese provincial and national CO2 emissions do not agree … There is a large gap between the two. We need to know which is right for accurate accounting and future targets.”

“The Orbiting Carbon Observatory (OCO) was a NASA Earth System Science Pathfinder Project (ESSP) mission designed to make precise, time-dependent global measurements of atmospheric carbon dioxide (CO2) from an Earth orbiting satellite.”

“OCO-2's primary science objective is still to substantially increase our understanding of how carbon dioxide sources and sinks are geographically distributed on regional scales and how their efficiency changes over time.”

Monday, June 30, 2014

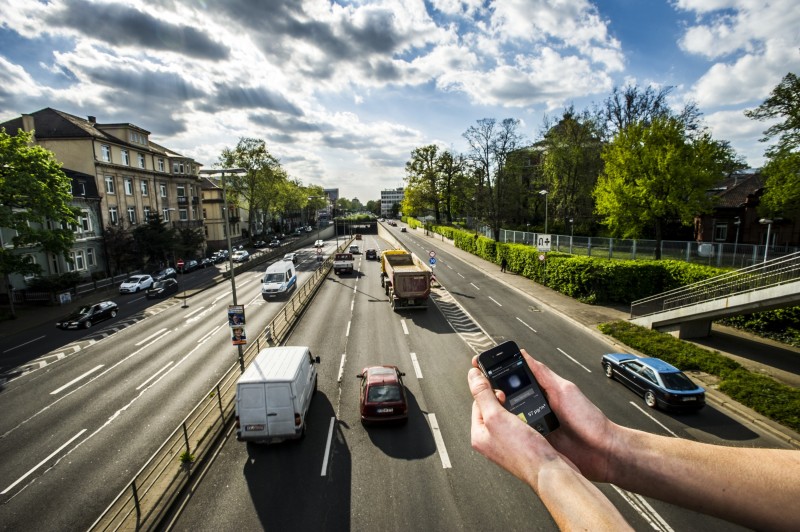
Another Use of SmartPhones to Monitor Traffic-Related Air Pollution (TRAP)

Measuring fine dust concentration via smartphone (ScienceDaily, Karlsruhe Institute of Technology, May 23, 2014)

Also discussed here: Enabling low-cost particulate matter measurement for participatory sensing scenarios (Abstract, Matthias Budde, Rayan El Masri, Till Riedel ,Michael Beigl, Proceedings of the 12th International Conference on Mobile and Ubiquitous Multimedia, Dec. 2, 2013)

And here:(2 min You-Tube, KIT Karlsruher Institut fĂĽr Technologie, May 21, 2014)

Today we review PhD research from Germany that describes how a commercial off-the-shelf (COTS)dust sensor can be attached to a smart phone, making use of its camera to measure the scattering of light and estimate the concentration of particulate matter (PM10) with an accuracy of one microgram per cubic meter. Readings may then be transmitted via cell phone to a central point where a number of other phone measurements can be mapped in near real-time and add to the more sophisticated (and expensive) observations from the few government air quality stations.

 smart phone dust sensor

Key Quotes: 

"Detectors at the official measurement stations operated by the Baden-WĂĽrttemberg State Agency for the Environment, Measurement, and Nature Conservation are very precise, but also very large, very expensive, and static. In Karlsruhe, for instance, only two measurement stations have been established,"

“This paper presents a mobile, low-cost particulate matter sensing approach for the use in Participatory Sensing scenarios. It shows that cheap commercial off-the-shelf (COTS) dust sensors can be used in distributed or mobile personal measurement devices at a cost one to two orders of magnitude lower than that of current hand-held solutions, while reaching meaningful accuracy”

“The sensor is planned to be attached to the smartphone by means of a magnet… and the users take a photo or a video for measurement. The images can be evaluated locally or transmitted to a computer system that combines these data with other measurements and sends them back. Then, the fine dust concentration is displayed by the phone.”

"Instead of the conventional infrared LED in the sensor, the flashlight of the smartphone emits light into the measurement area. This light is scattered by the possibly existing dust or smoke. The camera serves as a receptor and takes a picture representing the measurement result. The brightness of the pixels can then be converted into the dust concentration,"

“the smartphone sensor can measure concentrations of about one microgram per cubic meter. This is sufficient for detecting coarse dust and smoke, but not for typical fine dust concentrations in the microgram range. The scientists now plan to further increase the sensitivity of the sensors.”

“the central idea of participatory sensing is the joint benefit resulting from an increased information quality -- which increases with the number of measurements.”

Monday, May 26, 2014

Monitoring Personal Pollution Exposure and Location with a GPS

Using Global Positioning Systems (GPS) and temperature data to generate time-activity classifications for estimating personal exposure in air monitoring studies: an automated method(21 page pdf, Elizabeth Nethery Gary Mallach, Daniel Rainham. Mark S Goldberg, Amanda J Wheeler, Environmental Health, May 8, 2014)

 exposure by gps

Today we review research that looks at the advantages offered by a GPS and a PM2.5 particulate sensor to monitor 70 children and the pollution sources and durations they are exposed to over 10 days. The pollution sources vary between indoors and outdoors, using transit or driving, as well as in proximity to roadside emissions in the large metropolitan area that Montreal is. This approach improves upon the data that can be collected from a personal pollution exposure sensor that only produces the total pollution exposure over a given time period by breaking down the exposure by location. The use of a GPS also precludes the need to keep a diary as well as offering more convenience and accuracy, and possibly an effective way of monitoring larger populations for longer periods- if smart phones with a sensor were used for example..  

Key Quotes:

 “A pollutant mixture that varies within small spatial distances is urban air pollution. For example, specific traffic-related air pollutants are often higher on busy city streets in comparison to suburban ones [1]. Understanding personal exposure to air pollution is complicated by an individuals’ activities and where they are physically located, and the resultant interactions with different levels of air pollution”

 “we describe an automated classification of GPS data into location-based categories that makes use of temperature data to assist in discriminating indoor from outdoor locations.”

 “Mean times spent in different locations as categorized by a GPS-based method were comparable to those from a time-activity diary, but there were differences in estimates of exposure to PM2.5 from the two methods. An automated GPS-based time-activity method will reduce participant burden, potentially providing more accurate and unbiased assessments of location.”
Enhanced by Zemanta

Wednesday, December 4, 2013

Is there a Low-Cost Monitor to Measure Roadside Urban Emissions in Real-Time?


A Novel Method for Reliable Long-term Assessment of Exposure to Traffic-related Air Pollution Mixtures(Abstract, Natalia Mykhaylova, Kelly Sabaliauskas, Jon M Wang, Ezzat Jaroudi, Cheol-Heon Jeong, Jeff Brook, Greg J. Evans, American Association for Aerosol Research 32nd Annual Conference, Sep. 30-Oct.4, 2013)

Also discussed here: The Geography of Pollution - A PhD candidate’s low-cost sensors could be deployed across cities to gather highly local air-quality data (John Lorinc, UofT Magazine, Autumn 2013)

And here: Is Air Quality Affecting Your Health? - A U of T prof is looking at the relationship between traffic emissions, health and how close people live to major roads(John Lorinc, UofT Magazine, Jan. 11, 2013)

And here: Illness Costs of Air Pollution- Phase II:Estimating Health and Economic Damages(221 page pdf, submitted to Ontario Medical Association by DSS Management Consultants Inc, Jul. 26, 2000)

And here: The expanding scope of air pollution monitoring can facilitate sustainable development(Abstract, Knox A, Mykhaylova N, Evans GJ, Lee CJ, Karney B, Brook JR., Sci Total Environ. Mar. 15, 2013)

Today we look at a low-cost air quality monitor, developed at the University of Toronto, with the aim “to encourage local governments to deploy commercial versions of these low-cost devices in large numbers around urban areas as a way of generating a much more nuanced and up-to-the-minute picture of the invisible geography of pollution”. This is part of a larger research project aimed at assessing the health risks of roadside air pollution in Canada’s largest city where more than 2,000 people die prematurely each year according to the Illness Costs of Air Pollution (ICAP) model developed by the Ontario Medical Association and widely recognized by established authorities (such as the Auditor General of Canada and the Commissioner for the Environment for Ontario). The sensors provide a required precision of 5 to 15 ppb for O3 and NO2, 20 microgm/m3 for PM 2.5 and the entire cost of the unit is expected to be under $300.

 airquality_480  

Key Quotes:
“Toronto…has only four air-quality measurement stations providing real-time data, even though research shows that the concentration of pollutants such as nitric oxides, volatile organic compounds and carbon monoxide can vary by orders of magnitude within an area spanning just a few city blocks.”

“Best-performing sensors for detection of nitrogen dioxide, carbon monoxide, ozone, volatile organic compounds, fine particulate matter and coarse particulate matter, were selected, further optimized and integrated into a portable sensor array system. Temperature and humidity sensors were included for data normalization.”

“The types compared included n-type MOS, p-type MOS, optical, and electrochemical sensors”

 “the system could detect concentrations as low as 5 ppm level for total volatile organic compounds, 20 micrograms per meter cubed for fine particulate matter, 5 ppb for ozone, 15 ppb for nitrogen dioxide and 400ppb for carbon monoxide. The pollutant levels showed large variation both temporally and spatially, indicating the importance of high resolution monitoring.”

“The shoebox-sized device…will eventually be powered by lithium batteries and small solar panels. She estimates the total price of the components can be kept to less than $300”

“Mykhaylova and her team have placed a dozen of their homemade pollution monitoring stations in backyards near highways around the city and are trying to determine the traffic’s impact on nearby air quality.” “.

“We know that how much people are exposed relates to where they live relative to major roadways …the question is how that exposure, when combined with other factors such as genetics, leads to undesirable health outcomes. We’re trying to figure out how far one needs to be from the roadway to no longer feel the impact of the emissions.”
Enhanced by Zemanta

Monday, November 18, 2013

Health Impacts Downwind of the Alberta Oil Sands

Heavy air pollution in Canadian areas with excess cancers(MNT, Oct. 23, 2013)

Also discussed here: Study documents heavy air pollution in Canadian area with cancer spikes(UC Health, Oct. 22, 2013)

And here: Study says pollution, cancer a match near Canada industry(Orange County Register, Oct. 21. 2013)

And here: Oil sands pollution comparable to a large power plant(American Geophysical Union Press Release, Feb. 22, 2012)

And here: Air quality over the Canadian oil sands: A first assessment using satellite observations(Abstract, C. A. McLinden, V. Fioletov, K. F. Boersma, N. Krotkov, C. E. Sioris, J. P. Veefkind, K. Yang, Geophysical Research Letters, Feb. 2012)

Today we review research based on ground air quality monitors and remote satellite air quality imagery that points to the elevated levels of carcinogenic air pollution, downwind of oil sands processing plants in western Canada. This moves the debate about the Alberta oil sands from one about greenhouse gas emissions and climate change to one about direct health impacts, such as leukemia, for those who live downwind of these utilities. The findings indicated levels of volatile pollutants such as benzene higher than found in large polluted cities elsewhere in the world. It also underlined the value of taking actual measurements of air quality near industrial plants rather than depending on assumptions from models and stack emissions, as is the case with many urban incinerators, such as the Plasco municipal waste disposal plant near Ottawa. oil sands aq  

Key Quotes:

“found high levels of airborne pollutants, including the carcinogens 1,3-butadiene and benzene, downwind of Canada's industrial heartland in Alberta.”

“found higher levels of leukemia and non-Hodgkins lymphoma in men living near the pollution plumes than in neighboring areas not close to the pollution.”

 "Our study was designed to test what kinds of concentrations could be encountered on the ground during a random visit downwind of various facilities. We're seeing elevated levels of carcinogens and other gases in the same area where we're seeing excess cancers known to be caused by these chemicals."

 “The scientists took 1-minute outdoor air samples at random times in 2008, 2010 and 2012, in Fort Saskatchewan…All the samples showed similar results, including levels 6,000 higher than normal for some dangerous volatile organic compounds”

 "These levels, found over a broad area, are clearly associated with industrial emissions….They also are evidence of major regulatory gaps in monitoring and controlling such emissions and in public health surveillance."

“samples had higher levels of some chemicals than some of the world's most heavily polluted cities. When compared with air samples taken in Mexico City in the 1990s and in today's Houston-Galveston area - known to have high pollution - researchers found Alberta's samples contained more contaminants.”

“In the first look at the overall effect of air pollution from the excavation of oil sands, also called tar sands, in Alberta, Canada, scientists used satellites to measure nitrogen dioxide and sulfur dioxide emitted from the industry. In an area 30 kilometers (19 miles) by 50 kilometers (31 miles) around the mines, they found elevated levels of these pollutants.”
Enhanced by Zemanta

Monday, September 30, 2013

How to Monitor Urban Air Pollution? Go Fly a Kite!

Kite detects pollution, shines light on Beijing smog (Holden Frith, for CNN, Sep. 4, 2013)

Also discussed here: FLOAT Beijing

And here: Stars in the Haze(6 mi documentary video, Joshua Frank, Dec. 20, 2012)

Today we review a description of an award-winning project by a graduate student at Harvard University which adds air quality sensors (for ozone, carbon monoxide and particulates) to kites along with a display of trailing lights that indicates the relative pollution in real-time to those below.


float beijing  

Key Quotes:

“FLOAT Beijing, a network of air-quality monitors fixed to the kites traditionally flown across the city. Lights controlled by sensorS and trailing along the kite string like fireflies would give a simple readout of pollution levels: green for safe and red for danger.”

“The sensors used for the project measure carbon monoxide, ozone and general particulates.”

"We didn't just collect the data and put it on a spreadsheet online…We displayed it in a way that was really intuitive. Everyone understood that different colors mean different pollution levels and just the activity of kite flying itself was also a really exciting way to distribute information."

“Conceived by U.S. graduate students Xiaowei Wang and Deren Guler, FLOAT organized workshops in Beijing to teach both veteran and fledgling kite flyers how to build simple pollution sensors that travel into the Chinese capital’s soupy skies and send data back to the people on the ground.”
Enhanced by Zemanta