Thursday, August 27, 2015

What is a Fair and Ethical Reduction of Carbon Emissions for Nations to Meet their Climate Change Responsibilities?

Carbon emissions from various global regions d...
Carbon emissions from various global regions during the period 1800–2000 AD (Photo credit: Wikipedia)
Do US GHG Emissions Commitments Pass Ethical Scrutiny? (Ethics and Climate, Jun. 16, 2015) 

Now that the Pope’s encyclical has made ethics a major consideration for addressing climate change, the question is asked what level of reduction of carbon emissions is fair and ethical in order to keep the earth’s atmosphere below the accepted 2 degrees of warming? As 5% of the world’s population, the USA’s share of the required 270 gigatons carbon reduction would be 13.5 Gtc compared to the current emission rate of 1.44 Gtc/year and this, in turn, would point to a 95% reduction by 2050, not the 80% pledged by the USA in 2014. And this does not include the ethical issues of responsibility for the fate of developing countries which did not play a significant role by their carbon emissions in getting to the state of the world we are now in. Other developed countries with high emission rates need to consider their fair share as well, in the days and months leading up to the agreement on emission rates expected at the UN’s climate conference in Paris in December 2015. 

 Key Quotes: 

“On November 11, 2014…The United States pledged to cut its emissions to 26-28% below 2005 levels by 2025 while retaining a prior pledge to reduce US ghg emissions by 80% below 2005 by 2050” 

“there is a strong consensus among nations that unless nations reduce their ghg emissions to levels that represent each nation’s fair share of safe global emissions, there is little hope of preventing catastrophic warming“ 

 “On current trends, we'll blow the global carbon budget and lock in more than 2C of global warming in 17 ½ years” 

“the United States has also acknowledged the commitment was based upon what is achievable under existing US law rather than what may be required of the United States by ethics, justice, and basic fairness “ 

“the Intergovernmental Panel on Climate Change [in 2007] …concluded that developed nations needed to reduce ghg emissions by 25% to 40% below 1990 emissions levels by 2020 and 80% to 95% by 2050 for the world to have any reasonable chance of limiting warming to 2°C” 

 “If the total carbon budget to give the world a 66% chance of keeping warming below 2°C is 270 gigatons carbon (GtC), then because the US population is 5 % of world population, a case can be made that the United States carbon budget must be below 13.5 GtC ..Because the US is currently emitting 1.44.GtC per year, the US will have zero emissions to allocate to itself in 9.4 years at current emissions rates” 

“it is virtually certain that the US commitments can not be construed to be a fair allocation of the remaining carbon budget that is available for the entire world to limit warming to 2°C “

Monday, August 24, 2015

When to Apply Maximum Charges to Relieve Congestion?

A Bathtub Model of Downtown Traffic Congestion ( 8 page pdf, Richard Arnott, ACCESS, University of California, Jun. 10, 2015)

Today we review an analysis of the degree of congestion as a function of the timing of commuting and how applying a congestion charge can alter the flow sufficiently to allow free flowing traffic. This approach is called the bathtub model as it resembles the flow of water through a drain- as the water depth builds up the drainage rate increases up to a critical point when it decreases. In the same way, traffic reaches full congestion and then the flow slows down. Applying higher tolls as the traffic begins to reach the critical point reduces the traffic density and allows the flow to increase again.

 bathtub graph  

Key Quotes:

“the dynamics of rush-hour traffic have the same properties as water flowing into and out of a hypothetical bathtub….. The height of water in the tub represents traffic density. The rate at which water drains increases with the height of the water until it reaches a critical height. … corresponds to the density of downtown traffic at which traffic jams start to become common. Above this level, traffic jams become more severe and the exit stream slows.”

"Commuters arriving exactly on time experience no schedule delay but a large travel time cost since they travel when traffic is most congested. In contrast, commuters departing at the beginning of the rush hour experience little congestion and therefore shorter travel times, but they arrive at work considerably before their work start time, experiencing high schedule delay cost.”

“ideal congestion pricing, with its no-toll equilibrium rush-hour traffic dynamics. Equilibriumis achieved when no commuter can reduce her trip price by altering her departure time. The optimum time pattern of departures minimizes total trip costs.“

“These optimal conditions can be achieved by charging a time-varying congestion toll set so that each commuter pays for the external cost her trip imposes on others. Each commuter’s trip price then equals the social cost of her trip. Since commuters respond to the toll by altering their departure times so that the equal trip-price condition (now including the toll) continues to be satisfied, the social cost of each trip is the same, which is the defining feature of the optimum scenario.”

Thursday, August 20, 2015

A Guide to Implement Congestion Charging

Introduction to Congestion Charging: A Guide for Practitioners in Developing Cities  (58 page pdf, Dirk Van Amelsfort and Viktoria Swedish, the Asian Development Bank,  2015)

Today we review a comprehensive guide that describes the various steps necessary to develop and then implement a successful congestion charging system, borrowing on examples of established systems in Stockholm, London and Singapore, among others. Although aimed at developing countries, many of the principles and preparations needed are common to the developed world as well – such as, being prepared with responses to eight objections or concerns often made to any such scheme. The underlying objective has to include elements of fairness of application, as well as environmental and economic benefits with as few exemptions to being charged as possible.


Key Quotes:

“When people drive cars, they contribute to road damage, emit harmful pollutants, noise and vibrations and cause delays for others. Considering this, the travel decision of one individual imposes costs on others. In most transport systems the costs imposed on others are not fully paid for by the traveller. Congestion charging is a way to put such costs on drivers. “

“Arguments are that congestion charging (1) is unfair, (2) harms the privacy of citizens, (3) not achieve the intended effects and (4) will damage the economy. “

The higher the charge, the lower the public acceptability is, and travellers with a higher value-of-time perception have a higher acceptance of congestion charging …Even if a high value of time may correlate with income levels, these two things are not the same.”

“Factors that affect public acceptance:

Experience: The more experience …the higher the acceptance.
Dislike of government intervention: ..government should intervene as little as possible..
Interest in environmental issues: ..environmental problems are severe and need to be addressed will favour congestion charging more.
Value of time: The higher the perceived value of time.., the higher the acceptance for congestion charging… the more benefit travelers get in return for the paid charge.
Frequency of car use: The more travellers use their cars, the lower the acceptance level.”

“As soon as congestion charging policies become active - assuming all technologies function and the system is appropriately designed - people will find the system more acceptable. In most cases acceptability rises above a 50%.”

“Recommendations:

·         Focus on impacts
·         Do the homework
·         Use models to forecast effects
·         Prepare to respond to concerns
·         Make revenues generated and how the money is spent transparent
·         Invest in alternative travel options
·         Let the functional design drive the technological solution
·         Reduce political risk by building in redundancies that can later be removed
·         Make sure people understand how to use the system
·         Have a solid legal framework”


Tuesday, August 18, 2015

Monitoring local energy use from space

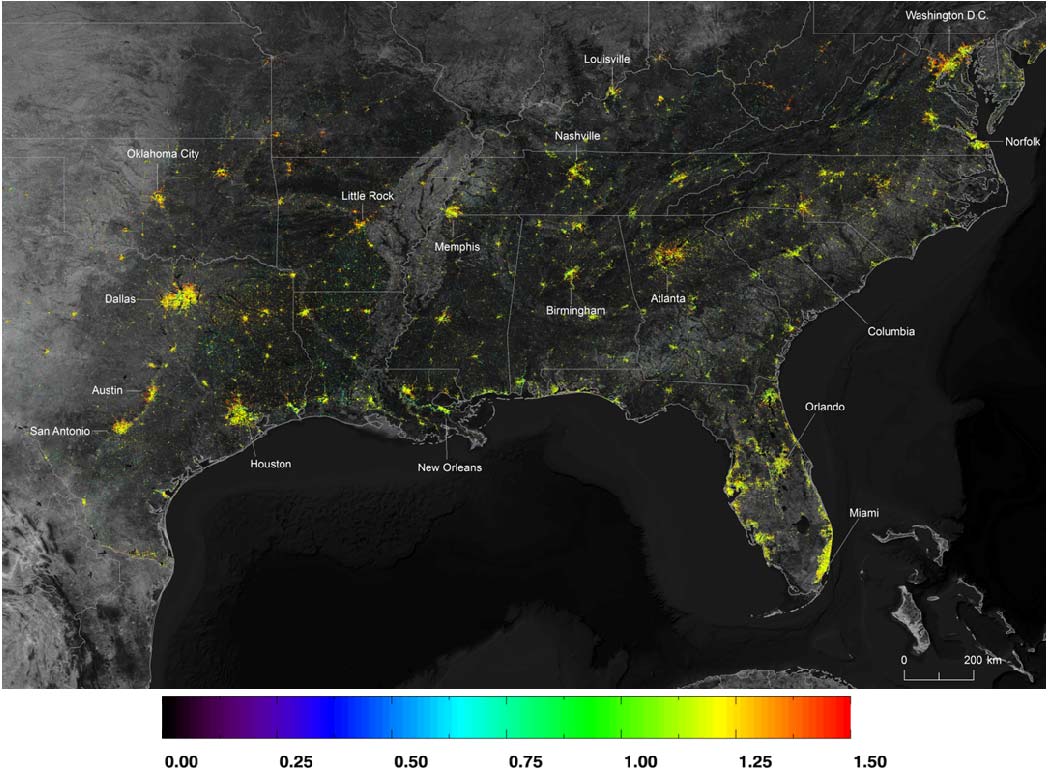
Holidays in lights: tracking cultural patterns in demand for energy services (39 page pdf, Miguel O. Román and Eleanor C. Stokes, Earth's Future , Jun. 2, 2015)

Today we review research aimed at monitoring various cultural responses at the city or neighbourhood scale level in different societies to efforts to reduce electrical power use from carbon fuel sources. The authors made us of three years of daily high resolution satellite data which showed different usage patterns based on different religious holidays (such as Christmas among Christians and Ramadan among Muslins). There appears to be potential for application of this technique to observe human behavior response in other countries world-wide.
 

Holidays in lights  

Key Quotes:

“most demand models lack basic contextual information on how dominant social phenomenon, the changing demographics of cities, and the socio-cultural setting within which people operate, affect energy decisions and use patterns.”

“Here we use high-quality Suomi-NPP VIIRS nighttime environmental products to:
(1) observe aggregate human behavior through variations in energy service demand patterns during the Christmas and New Year's season and the Holy Month of Ramadan; and
(2) demonstrate that patterns in energy behaviors closely track socio-cultural boundaries at the country, city, and district-level.”

“We processed 36 months of daily night-lights data, from early 2012 to late 2014, based on remotely-sensed estimates acquired from the Visible Infrared Imaging Radiometer Suite (VIIRS) Day/Night Band onboard the Suomi National Polar Orbiting Partnership (NPP) satellite”

“Accurate energy demand forecasting requires attention to the broader social contexts within which people operate, especially as these contexts change with globalization, economic development, and urbanization. We illustrate how the uniformities and variations between nighttime light signatures, as observed by the VIIRS instrument on Suomi NPP, can provide new insights into how energy behaviors, motivated by social incentives, vary across cultural boundaries.”

“individual factors such as poverty and irregular access to infrastructure services also affect energy behavior patterns, alongside macro-cultural forces.”

 “A globally systemic assessment of these activity patterns will lead to improved understanding of neighborhood-level energy intelligence, as well as conservation strategies that can be tailored to specific communities and socio-cultural contexts.”

Thursday, August 13, 2015

How Do Electric Fields under High Voltage Power Lines Compare to Those Near Highways?

Comparison of charged nanoparticle concentrations near busy roads and overhead high-voltage power lines (Abstract, E.R. Jayaratne, X. Ling, L. Morawska, May 28, 2015)

Also discussed here: Roadside air can be more charged than under a high-voltage power line (Science Daily, May 28, 2015)

Today we review research from Brisbane, Australia, comparing the number of charged particles emitted by vehicles near highways to what is found under power lines. Results indicate more than twice as many charged vehicles near roads. The charges alone do not present a health hazard but the fact that the particulates are charged means that they adhere more closely to the lungs when they are breathed in – and this as earlier research has shown presents a number of health impacts which would be increased by the electrical charging

 freeway electric field  

Key Quotes:

 “ a large number of charged particles in urban environments come from motor vehicle emissions ….within 10 metres of a freeway, charged particles were up to 15 times more concentrated than beneath high-voltage power lines."

 “the concentration of charged nanoparticles found near two freeways carrying around 120 vehicles per minute exceeded the corresponding maximum concentrations under two corona-emitting overhead power lines by as much as a factor of 5”

“most pronounced when a significant fraction of traffic consisted of heavy-duty diesel vehicles which typically have high particle and charge emission rates.”

“while there was no evidence that breathing in air ions was a health risk, approximately one-half of the fine particles that we inhale during normal breathing are deposited in our lungs. Therefore, it is not surprising that several studies have demonstrated a link between particulate pollution from exhaust fumes and adverse health effects.”

 "We do not believe that ions are dangerous -- the danger comes from the pollutants. The ions merely assist the particles to stick to the lungs. If there are no dangerous particles in the air to attach to the ions, there is no risk of ill health."

Tuesday, August 11, 2015

Can Vitamin E Reduce the Impact of Particulate Matter on the Lungs?

Circulating Levels of Antioxidant Vitamins Correlate with Better Lung Function and Reduced Exposure to Ambient Pollution (Abstract, Cristina Menni, Sarah J. Metrustry, Robert P. Mohney, Sean Beevers, Ben Barratt, Tim D. Spector, Frank J. Kelly, and Ana M. Valdes, American Journal of Respiratory and Critical Care Medicine, May 15, 2015)

Also discussed here: Link between vitamin E, exposure to air pollution (ScienceDaily, May 15, 2015)

And here: Can vitamin E protect lungs from air pollution? (Indo-Asian News Service, May 15, 2015)

Today we review research into the role that vitamins plays in lessening the damage to the lungs that particulate matter plays through oxidative attacks. Results indicate that higher exposure to PM 2.5 and PM10 had lower levels of vitamin E and lower levels of lung function.

 lungs-main  

Key Quotes:

“These new findings are consistent with previous reports which observed lower levels of vitamin E in people with lung conditions such as asthma…However, we do not yet fully understand which types of particulate pollution specifically damage the lungs or which vitamins best interfere with this pathway to reduce the level of damage,”

“The strongest association both with PM2.5 and FEV was seen with vitamin E. Individuals with a higher exposure to PM2.5 had significantly lower levels of alpha-tocopherol and also had lower lung function. These findings provide further evidence supporting the theory that PM damages lungs through oxidative attack while alpha-tocopherol acts to minimise oxidative injury.”

“looked at the association between lung function and a set of metabolites – chemical signatures circulating in the blood – and between these metabolites and exposure to PM10 and PM2.5”

"The researchers found that individuals with a higher exposure to PM2.5 had significantly lower levels of vitamin E and also had lower lung function”

Thursday, August 6, 2015

Exposure of New Born Babies to Traffic-Related Air Pollution

 Perinatal Exposure to Traffic-Related Air Pollution and Atopy at 1 Year of Age in a Multi-Center Canadian Birth Cohort Study (32 pge pdf, Hind Sbihi, Ryan W. Allen, Allan Becker, Jeffrey R. Brook, Piush Mandhane, James A. Scott, Malcolm R. Sears, Padmaja Subbarao, Tim K. Takaro, Stuart E. Turvey, and Michael Brauer, Environmental Health Perspectives, Mar. 31, 2015) 


Today we review research into the impact of short and longer term exposure to traffic related pollution on one year old babies. Results indicate a greater risk of allergies, especially for those who did not attend daycares with older children who seem to offer protection.
 
Mast cells are involved in allergy. Allergies ... 
Mast cells are involved in allergy. Allergies such as pollen allergy are related to the antibody known as IgE. Like other antibodies, each IgE antibody is specific; one acts against oak pollen, another against ragweed. (Photo credit: Wikipedia)[/caption]  

Key Quotes: 

"With the increasing rates of allergies amongst children in Canada and elsewhere, we were interested in determining if air pollution from traffic might be partially responsible," 

 "Understanding which environmental exposures in early life affect the development of allergies can help tailor preventative measures for children," 

"We also found that children who attended daycare or with older siblings in the household were less likely to develop allergic sensitization, suggesting that exposure to other children can be protective." 

“exposure to NO2 during the first year of life, but not during pregnancy, was positively associated with atopy at age one year."

“Children at one year of age developed more sensitization to food (12.5%) than inhalant allergens” 

“TRAP exposure after birth increased the risk for development of atopy to any allergens…“This association was stronger among children not attending daycare … compared to daycare attendees”