Friday, August 8, 2014

What is the Cost of Accumulated Carbon Emissions and Who Should Pay for Them?

Counting carbon: historic emissions from fossil fuels, long-run measures of sustainable development and carbon debt (25 page pdf, Jan Kunnasa, Eoin McLaughlin, Nick Hanley, David Greasley, Les Oxley and Paul Warde, Scandinavian Economic History Review, May 7, 2014)

Also discussed here: Who is responsible for climate change? (Science Daily, Jul. 4, 2014)

Today we review a very basic look at the cost of the carbon emitting countries not taking action earlier to reduce emissions to keep the accumulated atmospheric CO2 below a “safe” level of 350 ppm. The current level has just exceeded 400 ppm and the objective is to keep it below 450 ppm. The cumulative costs from 1902 to 2007, apportioned by emission source are estimated at over $6 trillion for the US, just over $4 trillion for the EU with China’s share rapidly climbing to just under $4 trillion. The costs in terms of climate impacts are felt by most if not all countries with the cost of refugees forced to emigrate by climate warming for example expected to increase eight fold to 200 million. The authors recommend the setting of a fixed carbon tax of $50/ton to account for this which balances the excess emission on the past when impacts were not as severe with the much greater impacts that result from excessive emissions recently.

 acc cost of co2  

Key Quotes:

 “The long half-life of the greenhouse gases means global warming is influenced by emissions accumulated over past centuries. Thus, past polluters owe a ‘carbon debt’ to the future generations…pollution from fossil fuels has both immediate flow and long-lasting cumulative stock effects on local, regional and global scales.”

“A carbon dioxide threshold of 350 parts per million (ppm) is generally considered the ‘safe’ level.9 This threshold has already been surpassed and the seasonally adjusted annual figure is estimated to reach 400 ppm in the spring of 2014 or 2015. The often mentioned 450 ppm target is a political compromise between risks and the costs of emission reductions”

“the commonly cited estimate …of 200 million people displaced when global warming takes hold could easily be exceeded. Even this estimate would mean an eight-fold increase over today’s entire documented refugee and internally displaced populations.”“the social cost of carbon (SCC), the monetised value of the marginal benefit of reducing one tonne of CO2 measured by its carbon content. This is determined by the marginal value of avoided damages…Using standard assumptions about discounting and aggregation, the marginal damage costs of carbon dioxide emissions are unlikely to exceed $50/tC (31.7 £/tC), and are probably much smaller”

 “a ton of CO2 added to an already large stock of atmospheric CO2 is likely to cause a higher damage than a ton emitted under a low concentration level”

“the USA has the highest cumulative cost of carbon emissions during the period 1902 -- 2009, contributing 24-27% of the cumulative global cost, followed by the EU with 17-19%. China is nowadays the biggest source of carbon dioxide, but the cumulative costs of its emissions are still long behind with 10-12%...41-47% of the costs are due to the cumulative emissions of carbon dioxide from the USA and the EU alone”

Wednesday, August 6, 2014

What is the Next Biggest Environmental Health Problem After Air Pollution?

Lessening the Severe Health Effects of Traffic Noise in Cities by Emission Reductions (28 page pdf, Tor Kihlman, Wolfgang Kropp, and William Lang, The CAETS Noise Control Technology Committee and the International Institute of Noise Control Engineering, May 2014)

Also discussed here: Traffic noise is dangerous for your health: Solutions exist for dense cities (ScienceDaily, Jul1, 2014)

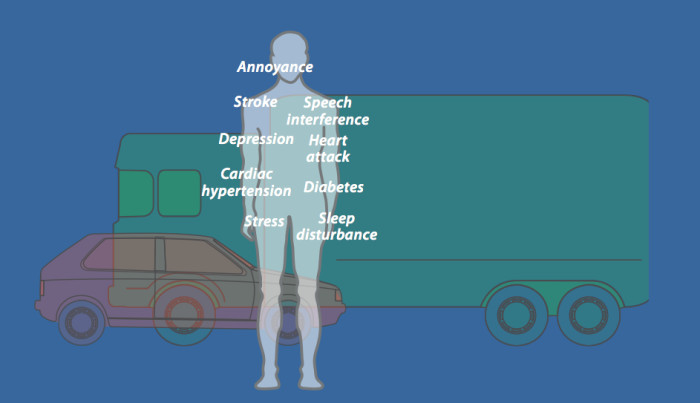
Today we review a report that looks at the second biggest environmental cause of health problems after air pollution, noise. As with air pollution, the single biggest source is road traffic from the interaction between tires and pavement or “rolling noise”. Solutions call for “quiet pavements” and improved design of tires although the authors report that present regulations and that most actions by government and industry fall well short of solving the problem. An interesting point was made about safety concerns about electric cars being too quiet to the point that government wants to require noise emitters – a step that is seen as unnecessary and counterproductive. Again, as with air pollution, an effective solution is to reduce roads traffic by promoting quiet forms of transportation, such as walking and cycling. Steps to reduce road noise would also benefit efforts to reduce greenhouse gases and climate change impacts.

 noise in cities  

Key Quotes:

“Traffic noise is the second biggest environmental problem in the EU, according to WHO. After air pollution, noise is affecting health the most….The adverse health effects of traffic noise are comparable to the health effects of road traffic accidents. Most cases of mortality are in areas where noise immission levels are less than 10 – 15 dB above WHO’s proposed intermediate targets.”

“In its 2009 guidelines for Europe, WHO has set Lnight < 55 dB as the interim target for healthy dwellings.”"In recent years, the scientific basis for assessment has broadened considerably. But the legislation to protect residents of unhealthy noise levels is completely inadequate,"

 "Many of the needed measures are ideal for implementation in dense cities. They are often in line with what is required to tackle climate change. Here are double benefits to point to…the procurement of quiet public transport, reduced speed, and the usage of buildings as as effective noise barriers, through good urban planning.”

“Rolling noise is an important part of the emissions. It depends on tyre and road surface properties…. .. There is no regulation on road surfaces with respect to their acoustic performance. There is no incentive for road “owners” and industry to improve the acoustic quality of road surfaces. Development of methods is needed.”

“A source-related measure besides “quiet pavements” is speed control esp. at night-time in sensitive areas. This is no effective method if not combined with noise emission limits for the vehicles at speeds well below 50 km/h.”

“Traffic planning and management is crucial to achieve healthier cities. Traffic avoidance, mode shifts, low speed limits especially at night-time must be part of the planning for healthier cities. Demands must be set on limited noise emissions on public transportation systems, goods delivery systems, garbage collection, street cleaning, among others.”

Friday, August 1, 2014

Has Municipal Waste Peaked?

Peak Waste? The Other Side of the Industrial Cycle (14 page pdf, Ugo Bardi, Virginia Pierini, Alessandro Lavacchi and Christophe Mangeant, Sustainability, Jun. 30, 2014)
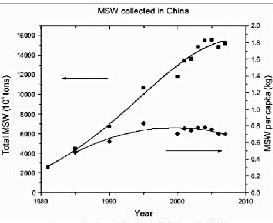
MSW china and USA_Page_1MSW china and USA_Page_2Today we turn our attention to one of the key areas of responsibility for municipalities (along with their control of traffic and road construction, water supply and local public health)- the collection of solid waste and storage in “city dumps”. The article under review looks at trends in garbage collection, pointing out that cities typically deal with short lived items such as packaging and perishable goods rather than the types of output of industrial waste which may include nuclear waste with lifetimes lasting hundreds of years.

Reference is made to the early work of the Club of Rome and its 1972 “Limits to Growth” world model, linking the economy to consumption of goods to pollution and waste, warning that, without a change, the global system would decline markedly. New data on waste now indicate that along with a peak in automobile, there now is an observed peak in municipal waste, citing the trends in the world’s leading producers of garbage (and greenhouse gases), China and the USA, a trend observed in other developed countries which is seen to be the result of efforts to reuse products and turn to renewable energy over carbon-based energy sources, as well as to more efficient waste treatment facilities.  

Key Quotes:

 “MSW generation levels are expected to double by 2025….This assumption is at the basis of choices such as incineration instead of landfilling, since the reduction in volume of the produced urban waste is often seen as a priority”

 “Model studies in the field of solid waste exist mainly for specific kinds of waste, e.g., electronics waste ..or automotive waste …, very rarely for the general concept of solid waste or municipal solid waste,”

“the concept that the limits to growth of the global economic system are not determined by “running out” of mineral resources, but by the fact that the industry tends to use the cheapest resources first….a peak in the generation of waste was to be expected in parallel with the general depletion trends of nonrenewable resources.”

“When dealing with municipal waste, we deal mainly with short-lived items, in large part packaging and perishable goods.”

 “waste generation in developed countries goes in parallel with the trends of industrial production and that several regions are showing a declining trend which may be interpreted in terms of “peaking” just as it is often done for the production of fossil fuels.”

 “it seems clear that better treatment facilities are leading to the recovery of larger amounts of metal which, consequently, do not end up any more in landfills”

“the “waste problem”, in terms of the need of new and expensive facilities may be often overemphasized in the current debate because decision makers still base their planning on the idea of a continuous increase in the amount of waste produced …Instead, if we are seeing a declining trend in the overall mass of waste produced, our priority should become to improve the recycling of solid waste by working towards a closed cycle economy.”

Wednesday, July 30, 2014

Monitoring Roadside Pollution with Sensors on Bikes

Cyclists will monitor air pollution in Hamilton (CBC News, Mar. 13, 2014)

Also discussed here: Bicycle Air Monitoring Program - Pittsburg (GASP)

Today we review two citizen initiatives in Hamilton and Pittsburg to monitor air pollution levels along roads and bike paths used by cyclists in these cities. The program that began first in Pittsburg with the Group Against Air Pollution and Smog, collects and displays the Particulate Matter on maps of the urban core in real-time. The Bicycling Air Monitoring program in Hamilton just began on June 26 with over 60 cyclists volunteering to use the 20 GPS and air monitors which were funded with only $25 K from contributions from volunteers and a local city Councillor. These data fill gaps in the map of air pollution measured by much more expensive provincial air quality monitors (over $250K each) or by using a specialized mobile van dedicated to roadside monitoring.

pittsburg pollution 

Key Quotes:

“Environment Hamilton officially launched its Bicycling Air Monitoring program (BAM!) Thursday at city hall, announcing plans to use volunteers from the local cycling community rig their bikes with air quality monitors and a GPS unit.”

“Environment Hamilton already has about 60 volunteers from Flamborough to Stoney Creek who are set to cut loose across the city using one of the 14 units to gather information. Two of the GPS units also have a video camera to provide a visual of what may be contributing to air quality, such as a construction or bumper-to-bumper traffic.”

“Environment Hamilton purchased the models after receiving close to $25,000 in funding…Councillor Chad Collins helped facilitate $10,000 through a fund provided to his ward for special projects, while Clean Air Hamilton pitched in the other $15,000”

"For me, for my constituents, air quality concerns are at the forefront of environmental issues in my ward. I have people who live adjacent to industry and I also have a number of residents along major transportation corridors."

“It's a quick visual way for a cyclist to assess which are the routes in the city that I want to choose if I'm worried about respiratory health and which are the ones that I should be avoiding”

“Bicycles can travel on bike paths and trails and so on… [the data] will be useful for filling in gaps where we aren’t able to go.”

“[Pittsburg] the purpose of this program is to study the objective data gathered by citizens equipped with a laser particle counter and GPS system. The goal of this project is to convey its findings (large and small particulate counts over time and space) as an easily-interpretable map. Large particulates are known as PM10, and small particulates as PM2.5, with the former able to stay in the air for minutes to hours, while the latter can remain in the air for hours to weeks, and travel very long distances. Due to the constantly-changing nature of the air, the more data we collect over routes over time, the more accurate will be the representation of our city. This will promote understanding of any major problems, and suggest ways to enact change.”

Monday, July 28, 2014

How Liable Are Cities Potentially for Not Reducing Greenhouse Gas Emissions by Allowing Traffic and Vehicle Emissions to Increase?

English: A schematic of the global air polluti...
English: A schematic of the global air pollution. The map was made by User:KVDP using the GIMP. It was based on the global air pollution map by the ESA (see http://www.esa.int/esaEO/SEM340NKPZD_index_0.html , http://esamultimedia.esa.int/images/EarthObservation/pollution_global_hires.jpg ) (Photo credit: Wikipedia)
Current environmental liability issues for municipalities (20 page Word doc, Graham Rempe, Dianne Saxe, Osgoode Professional Development, Jun.17, 2014) 

Also discussed here:Current environmental liability issues for municipalities (Meredith James, Envirolaw, Jun. 26, 2014) 


Today we review an interesting discussion paper that analyzes legal cases where failure to act or incorrect actions by municipalities resulted in contamination of the soil or groundwater with legal consequences for the municipalities involved. The accountability was particularly true when the health of humans or animals was threatened. One has to ask why municipalities do not have an obligation to manage traffic and vehicle emissions when these clearly are a major cause, if not the largest cause in some cases, of hastened climate change impacts or of pollution levels which have a direct impact on the health of their citizens. Especially when several far-sighted cities such as London UK, Stockholm and Singapore have demonstrated that application of congestion pricing and other measures within their mandates (as it is in Ontario) reduces traffic and improves air quality. Ontario’s Environmental Protection Act stipulates that “The only precondition is a reasonable belief that the ordered activities will prevent or reduce contamination of the natural environment”. 

What are cities waiting for- a law suit? If they are they do not need to wait very long at the rate that the climate is changing because of municipal inaction.


 Key Quotes: 

 “Few topics evoke more concern about “vast” liability than environmental mishaps. Municipalities and their legal advisors are well advised to carefully monitor developments in this area, where liability is writ large.” 

“s. 18 of Ontario's Environmental Protection Act ("EPA") applies to any person who "owns or owned or who has or had management or control of an undertaking or property". …provides for a number of measures, from monitoring and reporting, to planning and implementing remediation. The only precondition is a reasonable belief that the ordered activities will prevent or reduce contamination of the natural environment… These orders can be and are issued to municipalities” 

“The EPA provides that any prior conviction under a number of environmental statutes including the EPA, the Ontario Water Resources Act, the Pesticides Act, and others, is considered…municipalities can find themselves routinely exposed to mandatory minimum fines of $100,000 (and which may go as high as $10 million per offence).” 

“By following levels of air pollution and respiratory health over time, we could measure changes prior to and after implementation of these policies. Our study leverages these collected data in a way that it can contribute to the dialogue on whether pollution controls are effective in improving public health.” 

 “They analyzed a 17-year period after a variety of federal air pollution measures were instituted. Among others, national requirements lowered emissions from automotive engines, chemical plants and coal-fired power plants, and also targeted emissions that contributed to acid rain and depletion of the ozone layer of the atmosphere.” 

"the measures were designed to decrease carbon monoxide, nitrogen dioxide, sulfur dioxide, particulate matter and other compounds in the air that are considered major public health concerns, playing a role in an estimated 1.4 percent of deaths worldwide, and 2 percent of all cardio-pulmonary deaths worldwide.”

Friday, July 25, 2014

How Can Green and Cool (light-coloured) Roofs Mitigate Urban Heating?

The effectiveness of cool and green roofs as urban heat island mitigation strategies (17 page pdf, Dan Li, Elie Bou-Zeid and Michael Oppenheimer, Environmental Research Letters, May 2, 2014)

Today we review research on the urban heat island effect and how green roofs and high albedo “cool” roofs may be used to mitigate the amount of heating – which is becoming an even more important aspect, as global climate warming continues to increase the frequency and severity of heat waves in cities with the resultant growing impact on health. Results of the modeling show that over 90% of the roofs have to be green or cool in order to reduce the average air temperature by 0.5 C. Also, the soil moisture is critical for green roofs as dry soil has minimal effect on cooling. 

green roofs Key Quotes:

 “global climate change is expected to exacerbate the heat conditions in urban environment …heat waves, which are projected to become more frequent and last longer under a warming climate, interact nonlinearly with UHIs (urban heat island) to produce extremely high heat stresses for urban residents”

 “A green roof increases the evapotranspiration in urban areas through soil and plants on rooftops (redirecting available energy to latent heat), while a cool roof increases the reflection of incoming solar radiation in urban areas by increasing the albedo of roof surfaces”  

 “the daytime surface temperature of a green roof is substantially lower than that of a conventional roof due to evapotranspiration. The nighttime surface temperature on the green roof is also lower but the differences between roofs are less drastic”

“the significant cooling effect of green roof during daytime can probably last throughout the night due to reduced heat storage in the urban canopy”

“The cool roof strategy has a lower impact on the nighttime surface urban heat island than on the daytime surface urban heat island….the cool roof fraction that is needed for reaching a maximum reduction in the surface urban heat island of 1 °C is also about 30%... Approximately 95% cool roof coverage is needed in order to reduce the near-surface urban heat island by 0.5 °C at the time when the near-surface air temperature reaches its maximum.“ “when the soil moisture initial condition is somewhat dry (i.e., initial soil moisture is 0.15 or 0.25 m3m–3), the performance of green roof deteriorates significantly. "

 “The performances of green roofs and cool roofs are primarily affected by soil moisture and albedo, respectively”

“To reduce the near-surface UHI by 0.5 °C, the green roof fraction has to be close to 90% and the cool roof (albedo=0.7) fraction has to be close to 95%”    

Wednesday, July 23, 2014

How Well Does San Francisco’s Smart Parking System Perform?

Does San Francisco's Smart Parking System Reduce Cruising for a Space? (Eric Jaffe, The Atlantic City Lab, Jun. 25,2014)

Also discussed here: SFpark Project Evaluation Presentation (24 page pdf, San Francisco Municipal Transportation Agency, Jun. 19, 2014)

And here: SFpark Evaluation Shows Parking Easier, Cheaper in Pilot Areas (SFMTA Press Release, Jun. 19, 2014)

Today we review an evaluation of the project in San Francisco which introduced a modern parking pricing system in 2011 that raises (or lowers) parking charges according to demand and monitors in real-time when spaces are vacant or occupied. Results indicate that the project was successful in maximizing occupancy of parking spots and reducing the amount of needless circling by drivers looking for an empty spot(by 30%) - and as a result reduced the amount of fuel consumed and CO2 emitted (by 30%) - all while reducing the average hourly parking charge applied (from $2.69 to $2.58) and the number of citations issued (by 23%). One negative result was that over time the availability of parking spots at peak demand did not result as expected from the increased rates charged which leaves the management of rates and availability for further study. Coming next is application of smart metering to off-street parking lots and buildings.

 SF parking meter  

Key Quotes:  

“SFpark changes meter rates based on parking demand to maintain an average occupancy between 60 and 80 percent: When parking on a street is too full (or too empty), the hourly price goes up (or down) to free up (or fill up) spaces.”

“On average over the year of the study, when meter rates rose $1 per hour, occupancy fell 10 percent (and when rates fell $1 per hour, occupancy rose 7 percent).”

“Benefits:
  • Average on-street meter rates dropped by $0.11 per hour, or 4 percent;
  • Average garage rates dropped by $0.42 per hour, or 12 percent;
  • Target occupancy of 60-80 percent was met 31 percent more often;
  • Blocks were full (i.e., no available parking) 16 percent less often;
  • Average time spent searching for parking decreased by 5 minutes, or 43 percent;
  • Meter-related citations decreased by 23 percent; and
  • Vehicle miles travelled and greenhouse gas emissions from cars circling for parking decreased by 30 percent.”
“By making it easier to park and easier to pay, we have significantly reduced parking tickets and improved the experience for people who visit, live in, or work in some of San Francisco’s busiest commercial neighborhoods,”“San Francisco’s population and economy grew over the last three years and even as more and more people came to the city, we were able to reduce circling for parking and make the streets safer for everyone.”

“Strategies included:
  • Demand-responsive pricing;
  • Adding credit and debit card-enabled meters as well as pay by phone to make it easier to pay for parking;
  • Longer time limits at meters;
  • Real-time information about on- and off-street parking availability; and
  • Static wayfinding signs to garages.”
“The study raises a good question about whether occupancy or availability is a better measure of smart parking success. From a driver's perspective, availability is almost certainly more important. Far better to know that a spot will always be open, whatever the price, than to leave the house wondering.”