Thursday, July 7, 2016

How Could the USA Become Carbon Neutral by 2050?

100% clean and renewable wind, water, and sunlight (WWS) all-sector energy roadmaps for the 50 United States (Abstract, Mark Z. Jacobson, Mark A. Delucchi, Guillaume Bazouin, Zack A. F. Bauer, Christa C. Heavey, Emma Fisher, Sean B. Morris, Diniana J.Y.Piekutowski, Taylor A. Vencill and Tim W.Yeskoo, Energy and Environmental Science, May 27, 2015

Also discussed here: Here's what it would take for the US to run on 100% renewable energy (David Roberts, Vox Energy and Environment, May 3, 2016)

Today we review a report that details how the USA could reach 100% renewable energy sources by 2050 and what cost and benefits would be needed to accomplish that. 80-85% of existing carbon energy sources would be replaced by 2030 and the rest by 2050 with 49% wind power, 45% solar power and the remainder hydroelectric, geothermal, tidal and wave power. Benefits include $7.1 trillion per year in avoided climate impact losses due to US emissions and $600 billion per year in avoided health costs. The approach includes more emphasis on public transit and safer walking and cycling, mandating battery electric vehicles for short and medium distance driving, an expansion in the number and distribution of electric charging sites as well as a time of use that favours night time charging, and electrification of freight rail.
jacobson-us-renewables-2015
Key Quotes:

“This study presents roadmaps for each of the 50 United States to convert their all-purpose energy systems (for electricity, transportation, heating/cooling, and industry) to ones powered entirely by wind, water, and sunlight (WWS). The plans contemplate 80–85% of existing energy replaced by 2030 and 100% replaced by 2050.”

 “Year 2050 end-use U.S. all-purpose load would be met with ∼30.9% onshore wind, ∼19.1% offshore wind, ∼30.7% utility-scale photovoltaics (PV), ∼7.2% rooftop PV, ∼7.3% concentrated solar power (CSP) with storage, ∼1.25% geothermal power, ∼0.37% wave power, ∼0.14% tidal power, and ∼3.01% hydroelectric power.”

“Converting would further eliminate ∼$3.3 (1.9–7.1) tril. per year in 2050 global warming costs to the world due to U.S. emissions.”

“These plans will result in each person in the U.S. in 2050 saving ∼$260 (190–320) per year in energy costs ($2013 dollars) and U.S. health and global climate costs per person decreasing by ∼$1500 (210–6000) per year and ∼$8300 (4700–17600) per year, respectively.”

“Switching from liquid fuels to renewable electricity would also virtually eliminate air pollution, thus avoiding health costs to the tune of $600 billion a year by 2050.”

 “ moving everything to carbon-free electricity would avoid about $3.3 trillion a year in global climate change costs of US emissions by 2050.

Tuesday, July 5, 2016

All about Carbon Pricing: Carbon Tax? Cap and Trade?

Putting a Price on Carbon: A Handbook for U.S. Policymakers (56 Page pdf, Kevin Kennedy, Michael Obeiter, And Noah Kaufman, World Resources Institute, Apr. 2015

 Today we review a handbook to implement carbon pricing- either by tax or by cap and trade- in the USA. Among the points noted were that a low to moderate tax alone would be “highly unlikely” to meet the UN’s goal of keeping global warming to less than 2 C (as recommended by 195 states at COP21 in Paris). Technological innovations subsidized by government are also needed and these can be funded from carbon tax revenue as well as other benefits such as tax cuts, return of money to households and electric users, and helping those directly harmed by carbon taxes as well as reducing national debt. Canada and the USA are well behind Scandinavian countries (such as Denmark, Finland, Norway, and Sweden, beginning in the early 1990s) to establish a national carbon tax, although at the sub-national level, California and Western states, British Columbia, Alberta, Ontario and Quebec have started to price carbon in recent years. Another interesting point is that a moderate carbon tax of $28/tonne applied to the USA would impact low income earners by 2.5% (and high earners by only 1%). This identifies the need to neutralize the regression effects by subsidizing the low income group by this amount.

  carbon pricing basics  

Key Quotes:

"A carbon price would lead to reductions in U.S. greenhouse gas emissions and create leverage to encourage other countries to reduce their emissions, both of which are necessary to prevent the more severe effects of climate change. In addition, reduced fossil fuel usage will provide “co-benefits” in the form of reduced emissions of other harmful air pollutants.”

Some Potential Benefits of Carbon Tax:
  • TAX CUTS. The revenues from carbon pricing could be used to fund cuts in other tax rates. …
  • RETURNING MONEY TO HOUSEHOLDS OR ELECTRICITY CONSUMERS. Revenue from carbon pricing could be returned to households by sending them “lump sum” payments, which could be divided equally or by some alternative metric….
  • DEFICIT REDUCTION….. Carbon pricing revenues could be used to reduce annual deficits and thereby help to avoid such adverse economic effects.
  • INVESTING IN COMBATING CLIMATE CHANGE. In addition to its potential to stimulate innovation in low-carbon technologies (for example, renewable energy), a carbon price can provide revenue to help promote the development and deployment of breakthrough technologies
  • TRANSITIONAL ASSISTANCE. A portion of the revenues can be used to assist those likely to be most adversely affected by a carbon price…”
“A carbon tax is in some ways simpler than a cap-and-trade program. A tax does not require the government to allocate or conduct auctions for emissions allowances, or monitor the trading of allowances, and regulated entities do not need to participate in auctions or secondary markets for allowance trading.”

“The major advantage of a cap-and-trade program is that the policy sets a firm limit on the quantity of emissions that will be allowed.”

 “It is highly unlikely that a low to moderate carbon tax would achieve the level of emissions reductions the Intergovernmental Panel on Climate Change (IPCC) recommends in order to prevent the worst impacts of climate change”

“The longest-running programs are the carbon taxes established by Denmark, Finland, Norway, and Sweden in the early 1990s. National carbon taxes have also been established in recent years in France, Iceland, India, Ireland, Japan, Mexico, Switzerland, and the United Kingdom,”

 “Government support of research, development, and demonstration of measures to reduce emissions from energy, transportation, agriculture, or other sectors can fill the gap created by private sector under-investment, and help bring down the costs of breakthrough technologies. This, in turn, could help to drive more cost-effective emissions reductions and reduce the cost of complying with the carbon tax.”

“CBO has found that a carbon tax of $28 per metric ton of CO2 emissions would increase after-tax costs for the average household in the lowest quintile of the income distribution by 2.5 percent; for households in the top quintile, the carbon tax would increase after-tax costs by only one percent.”

Thursday, June 30, 2016

How Does Stress Add to Health Impacts of Air Pollution?

A Framework for Examining Social Stress and Susceptibility to Air Pollution in Respiratory Health (8 page pdf Jane E. Clougherty, Laura D. Kubzansky, Environmental Health Perspectives, Sep. 2009)

Also discussed here:EPA Workshop on Interactions between Social Stressors and Environmental Hazards (Abstracts, Environmental Protection Agency, Sep. 19, 2012)

And here: London parents see toxic air as 'the biggest health threat to their children (Nicholas Cecil , Evening Standard, Mar. 21, 2016)

Today we examine a literature review into the links between psychological stresses and air pollution. Historically studies have shown that asthma is exacerbated when a person is also exposed to traffic related air pollution. Some air pollutants affect oxidative stress and cell production. Stress also may affect the permeability of bodily membranes to allow greater chemical uptake by organs including the brain. Roadway noise causes higher stress and depression as well as a higher heart rate for those who live near traffic.

  stress and aq in london  

Key Quotes:

“Limited but growing epidemiologic evidence indicates that psychological stress may also alter susceptibility to physical exposures, such as air pollution. This work examined social environmental interactions in respiratory and cardiovascular disease, such as stress-related modification of traffic-related air pollution effects on asthma etiology ..or exacerbation”

 “some air pollutants and psycho-social stress may independently affect common physiologic processes such as oxidative stress …or inflammatory cell ..production”

 “Some evidence suggests that stress may alter permeability of bodily membranes to chemical exposures,such that stress may alter systemic transport and chemical uptake into organs including the brain..facilitating combined and synergistic effects of stressors and pollution on many bodily systems.”

“Evidence suggests that roadway noise, a spatial stressor correlated with pollution, increases heart rate among adults and children ..and living in high-traffic areas predicts higher stress, lower self-reported health, and depressive symptoms .. effects distinct from those of pollution”

Tuesday, June 28, 2016

How Does Early Action to Cut Carbon Emissions Reduce Impacts from Climate Change?

Differential climate impacts for policy-relevant limits to global warming: the case of 1.5 _C and 2 _C (25 page pdf,Carl-Friedrich Schleussner, Tabea K. Lissner, Erich M. Fischer, Jan Wohland, Mahé Perrette, Antonius Golly, Joeri Rogelj, Katelin Childers, Jacob Schewe, Katja Frieler, Matthias Mengel, William Hare, and Michiel Schaeffer, Earth System Dynamics, Apr. 21, 2016)

Also discussed here: 1.5°C vs 2°C: Why half a degree matters (Newsletter, International Institute for Applied Systems Analysis, Apr. 21, 2016)

Today we review research using scenarios with global climate models that show the difference in impacts from limiting global warming to 1.5 deg C or to 2.0 deg C by taking action to reduce carbon emissions and how quickly this is done. Many authoritative sources from COP 21 in Paris indicated that unless cuts of the order of 50% are taken within a decade (2025) that the 1.5 deg goal will be breached and unless the cuts reach 100% by 2050 that the 2 deg goal is probably unachievable. The paper examines the consequences of taking action too slowly or to a less than acceptable degree.

The impacts affect the length of heat waves (lasting 2 months more for 1.5C or 3 months for 2C), water availability, sea level rise, coral reefs and reduced crop yields. Perhaps the largest impact, sea level rise, has the largest implications because the processes involved in melting ice sheets are so large and slow moving. Once the Greenland ice sheet begins to breakdown, sea level rises of 5-7 m are inevitable over centuries with warming over 2C and will accelerate beyond 2100, while early action to limit warming to 1.5C would limit the sea level rise to 40 cm. Clearly policy makers at both the international and national/subnational levels need to step up to the challenge and soon. 2 deg climate impacts  

Key Quotes:

 “At the Paris Climate Summit the world decided to try to limit warming to below 1.5°C, in part because many considered climate impacts at 2°C to be too risky. Our new study provides essential new information about the risks under these two warming levels, and will feed into the ongoing international climate talks, helping policymakers deciding on the priority and urgency of climate action,”

“The additional 0.5°C would mean a 10-cm-higher global sea-level rise by 2100, longer heat waves, and greater risk of killing off tropical coral reefs.”

“On a global scale, the researchers anticipate sea level to rise about 50 cm by 2100 in a 2°C warmer world, 10 cm more than for 1.5°C warming. More importantly, however, is the rate at which sea level continues to rise in 2100. In a 1.5°C warmer world, this rate is about 30% lower than in a 2°C world, reducing our commitment to long-term sea-level rise. “

 “Substantial increases of 3 _C and more in TXx [hot extremes] over large parts of the Northern Hemisphere, central South America and South Africa as well as increases in warm-spell durations (WSDI) of 3 months and more are projected under a warming of 2 _C…The regional assessments indicate that the tropical regions in Africa, South America and South-East Asia are projected to experience the strongest increase in land area covered by heat extremes relative to the regional natural variability,”

“For a warming of 2 _C, reductions in water availability of up to 30% are projected in several – mainly subtropical – regions, in particular affecting the Mediterranean, South Africa, Central and southern South America and South Australia”

Thursday, June 23, 2016

What Are the Health Impacts from Urban Building Demolitions?

Ambient exposure to coarse and fine particle emissions from building demolition (Abstract, Farhad Azarmi & Prashant Kumar , Atmospheric Environment, Apr. 22, 2016)

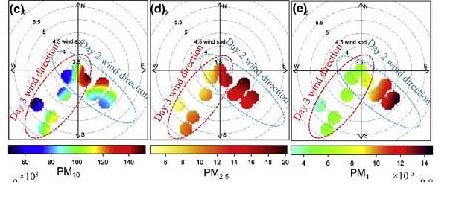
Today we review research into the dispersion of fine particles, including Aluminum(Al), silicate(Si) Zinc (Zn) and Magnesium (Mg), from a building demolition in London, UK, using a dispersion model that took into account windspeed and direction, decay over time and distance from the site. Demolition of buildings is expected to increase significantly, as a result of a 60% greater urban population over the next two decades, in addition to newer urban design forms and technologies.

The exposure to the particles noted above are linked to lung and kidney (renal) diseases, greater mortality and cardiovascular and Alzheimer diseases. Results indicate that concentrations of particulate matter (PM1, PM2.5 and PM 10) downwind of the demolition site is 4 to 11 times (respectively) greater than background levels, Males near or in the site inhale more dust than females and thus have a higher health risk. One could expect similar impacts from the digging of roads and construction of tunnels and ditches for Light and Heavy Rail Transit in large cities, currently in progress and planned for cities such as Toronto and Ottawa.

 demolition pm graph  

Key Quotes:

“Construction and demolition waste contribute up to about 33% of the total waste from all the streams; about half of which is demolition waste”

“This increased rate of building demolition could be linked to growing population of the urban areas and the need for improvements to meet new urban design guidelines and adopt building technologies ….the global urban population is expected to increase by about 60% in 2035 from the 2013 levels”

 “the RDD [respiratory deposited doses] of coarse and fine particles were found to be 58- and 5-times in the excavator vehicle cabin, respectively, which happens to be the highest exposure among all the assessed categories.”

“Exposure to Si have been linked with variety of adverse effects such as lung ..and renal … diseases; both of which have been found to result in increased rate of mortality... In addition, inhaling higher doses of Al have been associated with the cardiovascular … and Alzheimer’s .. diseases, besides leading to increased morbidity, particularly in older people.”

 “Since Si, Al and other elements such as Mg and Zn ..are integral part of inhaled particles, there is clearly an increased health risks at demolition sites.”

“The mass concentrations of average PM10, PM2.5 and PM1 were found to be about 11-, 3- and 4-times above the local background levels during fixed-site measurements at the downwind of the demolition site. The coarse particles (PM2.5e10) contributed majority(89%) of the total PMCs.”

 “The male subjects inhale more doses of particles than female subjects, because of their higher body tidal volume and breathing frequency and that the rate of deposited particles could considerably increase during heavy exercises by workers for the same emission source.”

Tuesday, June 21, 2016

What is the Risk of Cancer from Exposure to Particulate Matter?

Cancer Mortality Risks from Long-term Exposure to Ambient Fine Particle (Abstract, Chit Ming Wong, Hilda Tsang, Hak Kan Lai, G. Neil Thomas, Kin Bong Lam, King Pan Chan, Qishi Zheng, Jon G. Ayres, Siu Yin Lee5, Tai Hing Lam1, and Thuan Quoc Thach1, Cancer Epidemiol Biomarkers Prev, Feb. 22, 2016)

Also discussed here: Exposure to particulate air pollutants associated with numerous cancers (ScienceDaily, Apr. 29, 2016)

Today we review research that looks at the impact of fine particulates on health, specifically on the risk of cancer, based on 10 years of exposure to this pollution for a large sample of older people (older than 65), living in an urban environment (Hong Kong). Results indicate for every 10 µg/m³ increase in exposure, the risk of dying by cancer goes up by 35% for men (mainly in the digestive tract) and for women the risk of mortality because of breast cancer goes up by 80%. The authors caution that more research is needed to look at the link between cancer other air pollutants in combination with particulate matter.    

Key Quotes:

“long-term exposure to environmental pollutants was associated with increased risk of mortality for many types of cancer in an elderly Hong Kong population.”

“For every 10 microgram per cubic meter (µg/m³) of increased exposure to PM2.5, the risk of dying from any cancer rose by 22 percent... with a 42 percent increased risk of mortality from cancer in the upper digestive tract and [for men] a 35 percent increased risk of mortality from accessory digestive organs, which include the liver, bile ducts, gall bladder, and pancreas.”

“For women, every 10 µg/m³ increase in exposure to PM2.5 was associated with an 80 percent increased risk of mortality from breast cancer,”

"Long-term exposure to particulate matter has been associated with mortality mainly from cardiopulmonary causes and lung cancer, but there have been few studies showing an association with mortality from other cancers. We suspected that these particulates could have an equivalent effect on cancers elsewhere in the body."

"The limitation to this study is the sole focus on PM2.5. Emerging research is beginning to study the effects of exposure to multiple pollutants on human health. We must be cautious though, as pollution is just one risk factor for cancer, and others, such as diet and exercise, may be more significant and more modifiable risk factors."

Thursday, June 16, 2016

Limits to Growth – a critique after 40 years

Limits Revisited - A review of the limits to growth debate (24 page pdf, Tim Jackson and Robin Webster, Apr., 2016)

Today we review a report card on the 1972 Club of Rome report that looked ahead in 12 scenarios for the century ahead to examine the links between and among population, the economy, consumption of resources and pollution of the land, water and air. The indication that oil production would peak in 2015 if no corrective action were taken is strikingly accurate, given the shift now taking place in renewable energy production. On the other hand the report did not take into account the following ecological processes in regulating the environment: climate change, ocean acidification, biodiversity loss, interference with global nitrogen and phosphorous cycles, ozone depletion, global freshwater use, land system change, atmospheric aerosol loading and chemical pollution. Of these, four have deteriorated into an uncertain future: biodiversity loss, damage to phosphorous and nitrogen cycles, climate change and land use.

Although there are hopeful signs that economic growth may be decoupling from the environment with respect to reduced carbon emissions though technological innovations, the social burden continues to get worse with more than 3 billion people trying to live on less than $2 per day, as underlined by the encyclical by Pope Francis. An uncontrolled collapse is still possible, not from consuming all remaining natural resources but because of the degraded quality of those resources. As the report concludes: “an early policy response matters”.

 graph limits  

Key Quotes:

 “Limits Revisited outlines the contents of the Club of Rome’s report, traces the history of responses to it and dispels some of the myths surrounding it.”

 “The 1972 report articulated for the first time the dynamic nature of our dependency on physical resources and on ecological systems. It illustrated the processes of ‘overshoot and collapse’ that can occur when these limits are approached and suggested that, without a shift in direction, adverse consequences would become obvious “within the next century””

“The MIT team presented and analysed 12 scenarios, each with a different pattern of world development from 1900 to 2100…Only four scenarios avoided overshoot and collapse. These scenarios combined stabilising the human population with measures to restrict industrial output per person, as well as technological solutions like resource recycling and pollution control… One scenario which didn’t introduce these measures until 2000 managed to reached equilibrium, but not permanently…The diversion of more and more capital to extracting them [natural resources] leaves less for investment in industry, leading to industrial decline starting in about 2015. Around 2030, the world population peaks and begins to decrease as the death rate is driven upwards by lack of food and health services.”

 “A 2015 analysis of the remaining fossil fuel resources in China, USA, Canada and Australia, which includes unconventional resources, suggests that overall oil production is in fact peaking already… World fossil fuel production is likely to peak in around 2025, it suggests, largely as a result of Chinese coal production peaking. In short, unconventional oil seems to buy us several more decades before resource depletion starts to bite.”

“For each process, the team identified a ‘zone of uncertainty’ and a ‘danger zone’. Crossing over these thresholds could mean “non-linear, possibly abrupt and irreversible earth system responses” with disastrous consequences for society.. in 2015 found that four of these planetary boundaries had already been crossed. Biodiversity loss, damage to phosphorous and nitrogen cycles, climate change and land use have all slid into or beyond the ‘uncertainty zone’.”

“»In the last two years, carbon emissions from burning fossil fuels and industry flattened and even fell slightly, while GDP increased by 3.4% and 3.1% respectively.… it’s essential to distinguish between what’s called relative decoupling – a decline in the material intensity of economic output – and absolute decoupling – an absolute fall in material use or emissions. Much of what is celebrated as decoupling is relative rather than absolute decoupling.”

 “key issues:
  • the economic implications of declining resource quality;
  • the financial market implications of low-carbon investment strategies;
  • the political implications of the need for precautionary, longterm thinking;
  • the social implications of inequality in the distribution of available resources;
  • the macroeconomic implications of secular stagnation or degrowth.”