Thursday, April 28, 2016

What are the Overall Benefits of Road Pricing beyond Revenue Generation and Congestion Management?

Next Generations of Road Pricing: Social Welfare Enhancing (15 page pdf, Omid M. Rouhani, Sustainability, Mar.11, 2016)

Today we review a paper that looks beyond the two factors often used to justify road pricing: raising cash and reducing traffic congestion. Some of those factors are public acceptability, equity and the fact that only 26% of the important factors are generic- much depends on local factors that differ from one location to another – which perhaps explains why congestion pricing (and carbon taxes for that matter) are overwhelmingly accepted in places such as Stockholm and British Columbia but vigorously rejected by the public in many US and Canadian cities.

Some of the implementation decisions involve the spillover of traffic from a tolled road to its neighbours (which supports the notion of tolling existing roads and not just new ones) and then need for alternatives to road use (i.e. walking, cycling, public transit) for those who need to travel and the need for flexibility in terms of the rate to be charged and finally the need to make clear at the onset the overall benefits or welfare to the travelling public.

 road pricing welfare  

Key Quotes:

“the actual adoption of RPs has been very limited … Several barriers constrain their implementation. The most important is politics. A strong and devoted political champion is required for such new policies. Politicians are often not willing to risk their election prospects for a system where success is not guaranteed.”

“Two major goals drive the road pricing decision: revenue generation and congestion management.…other objectives are pursued as well, including transportation-related emissions reduction .. public transportation use or mode shift encouragement .. land use management .. and social welfare maximization”

 “time-based pricing provides the greatest social benefits, followed by distance-based, congestion (zonal) pricing, and cordon pricing.”

“only 26 percent of factors affecting implementation of RPs are generic, and that dominant factors are those factors, such as public acceptability.. and equity .. that result from particular features of the case study. This is the major reason why various models are required for predicting the outcomes of a scheme both before and after its implementation”

 “To support a more sustainable and welfare-enhancing transportation system, RP schemes should be implemented where high quality travel alternatives such as public transportation, biking lanes, walking facilities, ridesharing and other services are available”

“Tolls on few roads, especially with unlimited (high) profit-maximizing rates, could increase total travel costs for a transportation system as a whole because of spillover effects to un-tolled sections .. suggests creating and applying congestion pricing on existing roads, not only on (limited) new facilities.”

“The important factors:
  • take profits from road pricing into account, contrary to economists’ approach
  • examine the impacts of pricing on transport systems as a whole not only the priced facility or the charge zone
  • consider the demand risk (uncertain future demand) in the analysis, using a scenario analysis
  • include the disutility resulting from travel discomfort of road pricing
  • improve public transport systems to provide/encourage an environmentally-friendly alternative to driving
  • provide the vision to users and residents why road pricing increases welfare
  • explore equity implications
  • offer a flexible, but capped, tolling/pricing system that allows tolls to vary temporally
  • include impacts on sectors outside transportation"

Tuesday, April 26, 2016

The Environmental and Health Benefits of Trees in Cities– a Literature Review

Lost Ecosystem Services and Vanishing Ecologic...
Lost Ecosystem Services and Vanishing Ecological Roles. Forest ecosystems in the tropics and subtropics are being quickly replaced by industrial crops and plantations. This provides large amounts of goods for national and international markets, but results in the loss of crucial ecosystem services mediated by ecological processes. In Argentina and Bolivia, the Chaco thorn forest (A) is being felled at a rate considered among the highest in the world (B), to give way to soybean cultivation (C). (Photo credit: Wikipedia)
Health and climate related ecosystem services provided by street trees in the urban environment (17 page pdf, Environmental Health, Mar. 8, 2016)

Today we review an extensive literature review (with 156 references) of research concerned with the role of trees in an urban ecosystem services (ESS) framework and how that affects the environment, health and climate change mitigation for cities. Past studies have focused not only on the health benefits of trees, but also the conditions where trees can lead to lower air quality.

The paper describes the physical role of trees in allowing for more moisture to be released from the soil to the atmosphere as well as the effectiveness of some trees (with large leaves) to capture air pollutants while at the same time reducing the ventilation and dilution of pollution along tree-lined streets. Pollen from trees causes asthma and allergies in as much as half the population of some cities. The authors suggest that a systems dynamics approach might help to consider the many dynamic processes involved in order to improve urban planning into the use of trees.

 Key Quotes:

“current scientific understanding of the impact of street trees on human health and the urban environment has been limited by predominantly regional-scale reductionist approaches which consider vegetation generally and/or single out individual services or impacts without considering the wider synergistic impacts of street trees on urban ecosystems. “

Key Points:
  1. “the diversity in ESS for urban street trees, as well as
  2. the importance of tree species, density and location in service provision for any given location, and
  3. the implications and potential health and societal effects of optimising for a singular service
“in Bangalore, India ..afternoon ambient air temperatures were 5.6 °C lower in roads lined with trees, and road surface temperatures 27.5 °C lower than those measured in comparable tree-less streets “

“The potential impact of street trees on air quality remains one of the most poorly understood aspects of the studied ecosystem services and benefits …Most studies at regional or city scales show a modest modelled reduction in pollution concentration of less than 5 % resulting from urban vegetation”

Trees absorb CO2 and gaseous pollutants such as O3, NO2, SO2 primarily by uptake via leaf stomata or surface, and accumulate airborne particulates (by interception, impaction or sedimentation) more effectively than other urban surfaces“

“Trees emit biogenic volatile organic compounds (bVOCs) as a reaction to stress in their environment, such as high light intensities and/or temperatures or low water availability .. Isoprene is the most abundantly emitted bVOC [92]. In the presence of NOx and sunlight, isoprene contributes to ozone formation“

“Exposure to allergenic pollen from trees is associated with a range of health effects, including allergic rhinitis, exacerbation of asthma in susceptible individuals, and eczema.. Estimates of the levels of tree pollen allergies in the population range from around 5 % to over 50 % in Europe”

“systems dynamics approaches could also be used to capture the complexity and dynamic interactions occurring within urban systems, and has been used previously to integrate information from different disciplines and sectors whilst maintaining a health focus.”

Thursday, April 21, 2016

How Does Noise in the City Affect Its Residents?

How City Noise Affects Residents' Health (The Atlantic , Mar. 1, 2016)

 Also discussed here: Noise and the City Blog

And here: Greater Boston Neighborhood Noise Survey (Noise and the City)

And here: Pinpointing the Health Impacts of Urban Noise

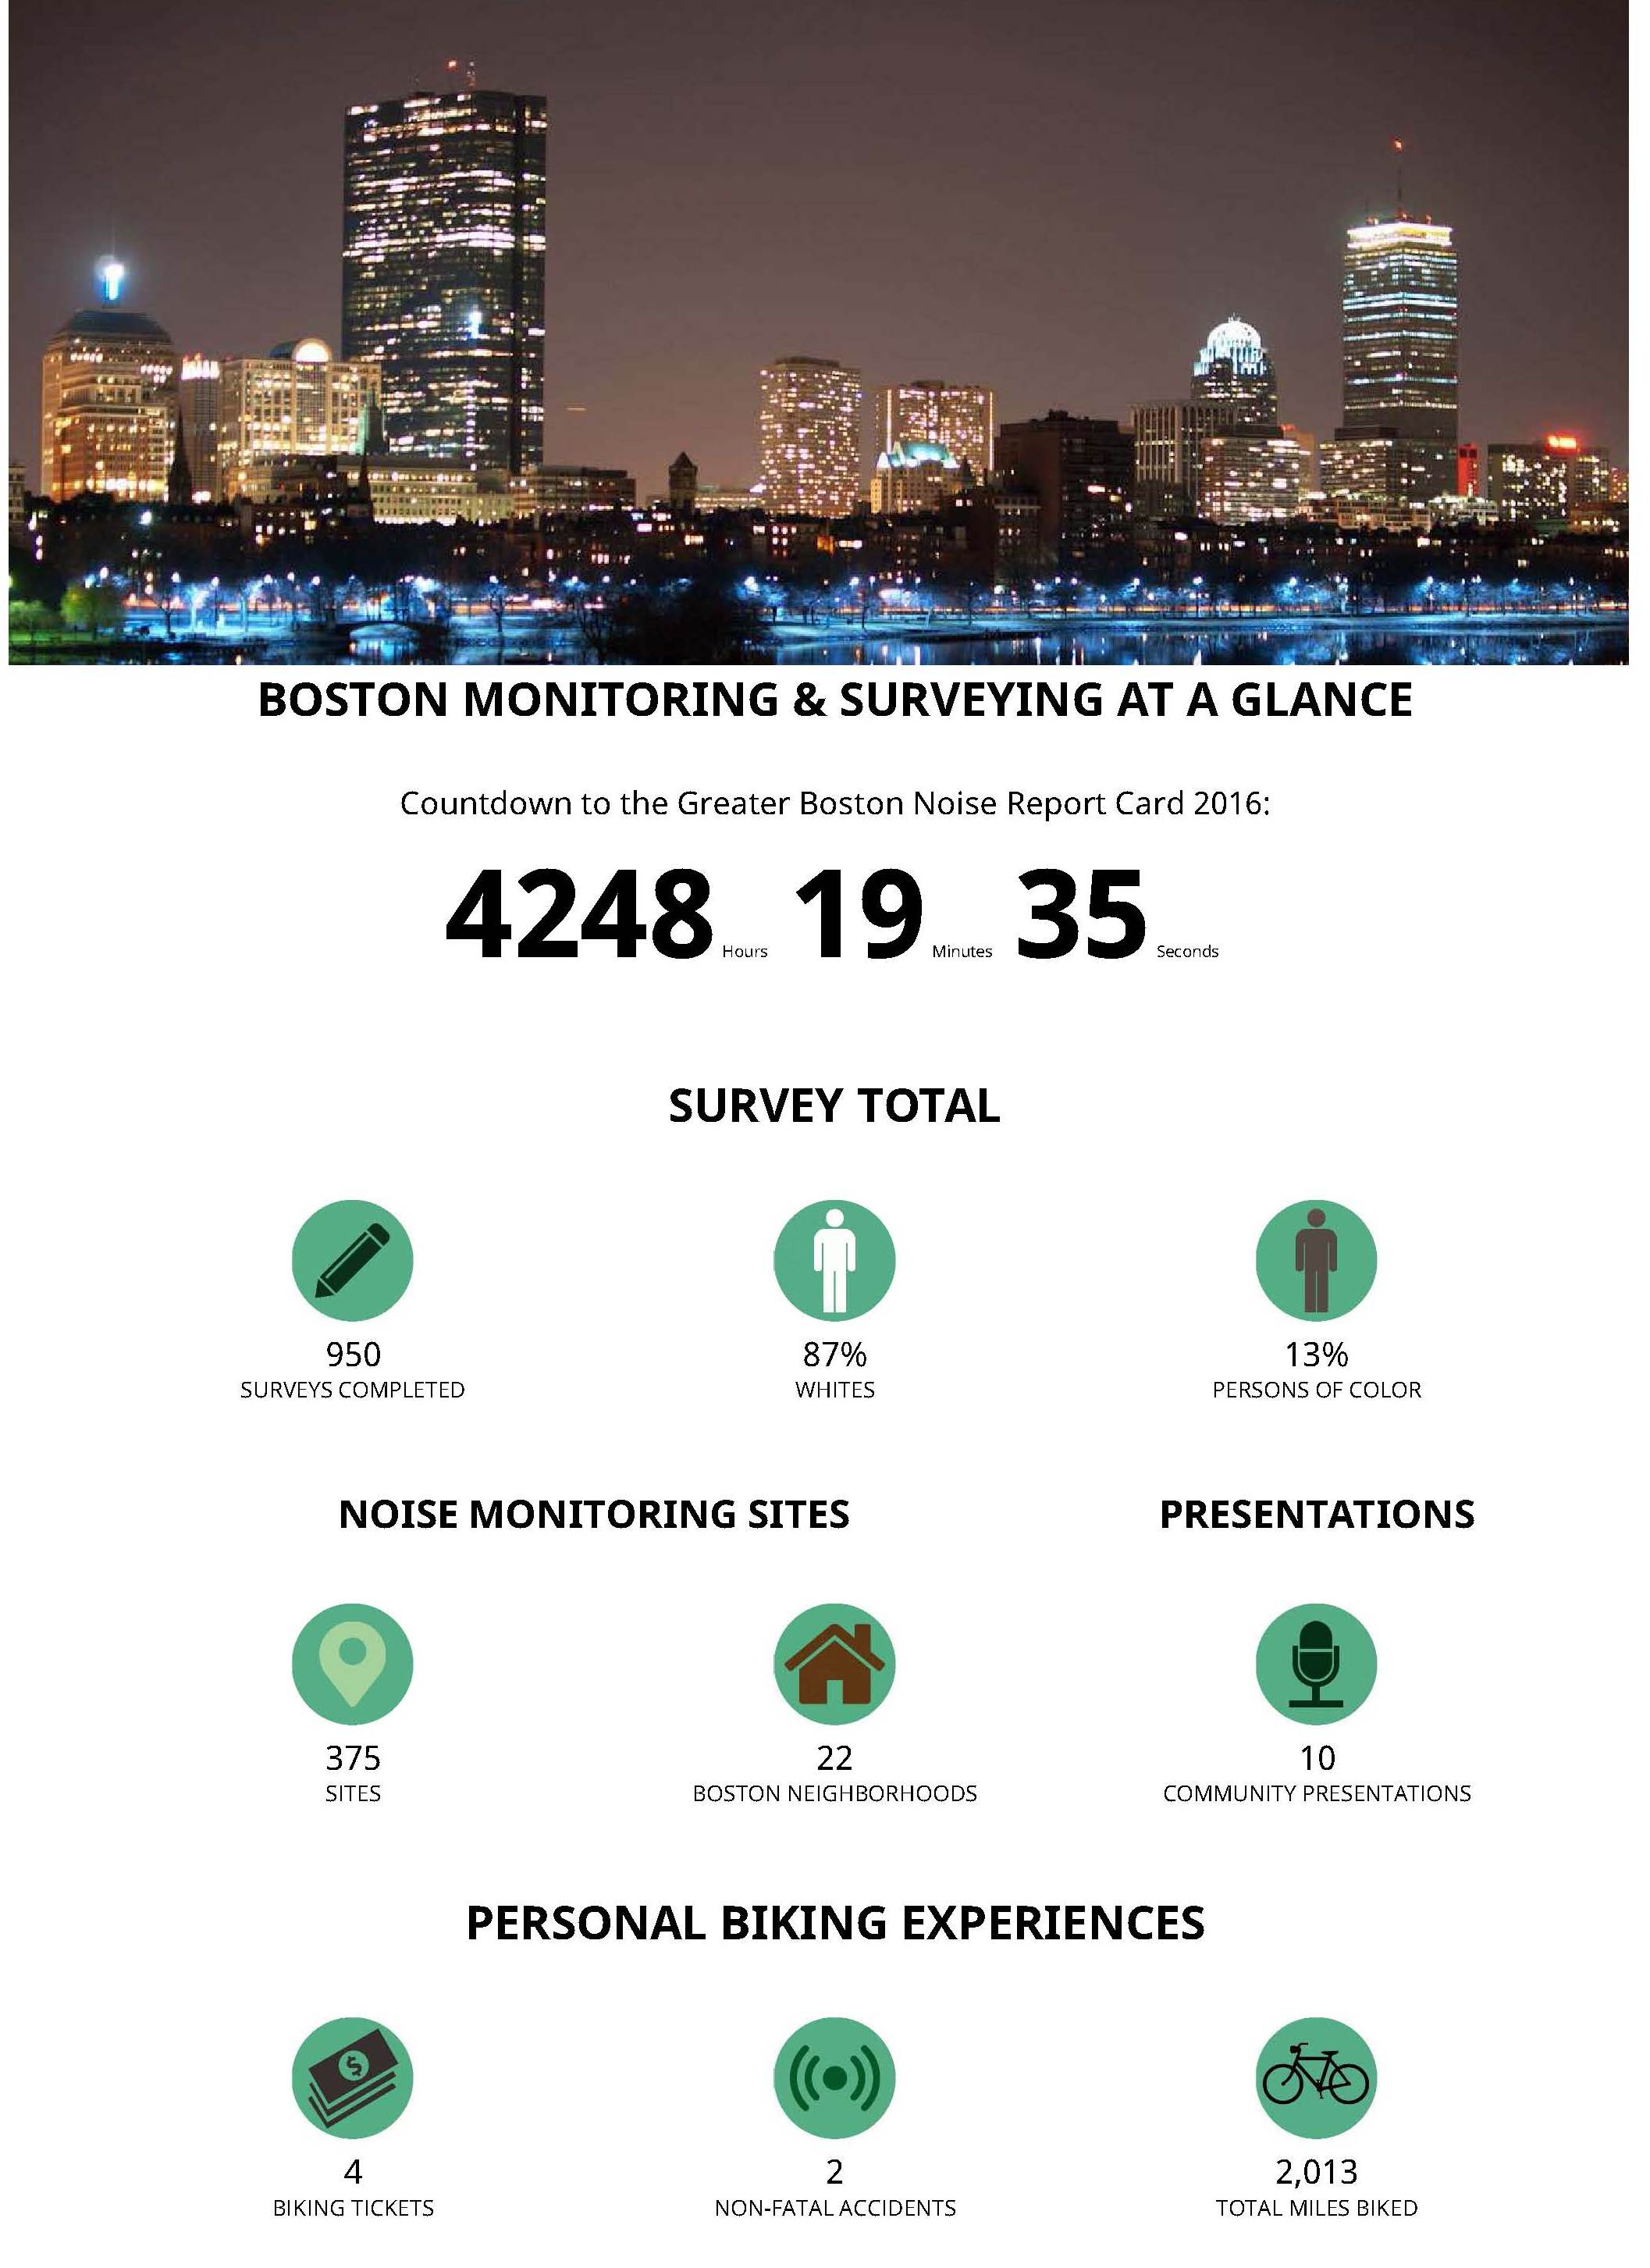
Today we review progress on a project by a PhD candidate at Harvard School of Public Health to measure and monitor the noise in neighbourhoods of a large American city (Boston) as well as conduct a survey of residents to assess their reaction to noise. The noises include traditional road noise from traffic, as well as the hidden ones such as vibrations and low frequency noises from underground subways or idling trucks. While we await her thesis, those interested in the project can follow progress at her blog at http://noiseandthecity.org/monitoring-and-surveying-at-a-glance/ .


Boston_ Monitoring and Surveying at a Glance - Noiseandthecity.org_Page_1 boston noice map-big    

Key Quotes:

 “aim is to measure just how loud different neighborhoods, streets, even crosswalks are. At the same time, she asks residents to fill out surveys about the impact city noises have on their lives and sanity.”

“Noise is insidious…It affects you acutely, but also long-term. This is something that people don’t really talk about, but something people really suffer from.”

low-frequency noise may be the most insidious. The subway train rolling underneath one’s feet, the airplane taking off, an idling diesel truck or city bus—these are the frequencies that are often more of a vibration than an audible sound,”

“We shouldn’t just throw out components that we think they don’t hear, we should consider the whole spectrum…And we should ask the community what they’re bothered by. If you’re going into a community and you’re monitoring noise, you need to ask them, what’s bothering you? Then you can make connections between noise and health.”

“Walker plans to create a “perceived noise map,” which compares the perceptions of Boston residents to the readings she’s taken with her decibel meter. Eventually, a noise value could be assigned to every residence in Boston.” “Cities will never be quiet..But they can be quieter.”

Tuesday, April 19, 2016

What are Countries Doing to Protect Human Health and Ecosystems?

Global Metrics for the Environment, 2016 REPORT, Environmental Performance Index (12 page pdf, Yale University, Jan. 24, 2016)

Also discussed here: U.S. Could Do Much More To Protect The Environment, Report Finds (Huffington Post, Jan. 27, 2016)

And here:Environmental Performance Index- Air Quality (Yale University, Jan. 24, 2016)

Today we review the 2016 Environmental Performance Index, prepared by Yale University which ranks the performance of countries in two areas: protection of human health and protection of Ecosystems. While improvements were seen in most categories, air quality is becoming worse mainly as a result of increased concentrations of fine particulate matter, especially in urban areas. While only 2% of global deaths (1.24 million) are caused by unsafe drinking water (and that is due to 80% of waste water not being treated), poor air quality caused 10% of global deaths (5.52 deaths). Overall, Finland tops the list in all categories with policy commitments made to achieve carbon neutral status by 2050. Other Scandinavian countries are near the top while North American countries such as Canada (ranked overall at #16) or the USA (ranked 26) are not achieving as much. This also applies to air quality where Canada at #26 and USA at #36. env perf index 2016  

Key Quotes:

 “The Environmental Performance Index (EPI) ranks countries’ performance on high-priority environmental issues in two areas: protection of human health and protection of ecosystems.”

“Finland has taken the top spot, followed by Iceland, Sweden, Denmark, and Slovenia. Finland’s top ranking stems from its societal commitment to achieve a carbon-neutral society that does not exceed nature’s carrying capacity by 2050,”

“The Index’s bottom third, comprised mostly of African countries with a smattering of South and East Asian nations, is a list of troubled states whose problems extend beyond their inability to sustain environmental and human health”

“In 2013, unsafe water was responsible for 2 percent of global deaths (~1.24 million), while poor air quality was responsible for 10 percent of all global deaths (~5.52 million).”

 “More than 3.5 billion people - half of the world’s population - live in nations with unsafe air quality.” “34 percent of global fish stocks are overexploited or collapsed.”

 “More than 80 percent of the world’s discharged wastewater is untreated when it’s released into the environment.”

 “Around one-third of countries scored on Climate and Energy are reducing their carbon intensity” “Environmental regulations in the country [USA] are less stringent than regulations in some European countries, according to the International Union for Conservation of Nature. And congressional Republicans have repeatedly tried to weaken regulations the Environmental Protection Agency has put into place”

 "While many environmental problems are the result of industrialization, our findings show that both poor and wealthy nations suffer from serious air pollution,"

 "With the very survival of the planet at stake, we hope leaders will be inspired to act -- especially in urban areas where an increasing majority of the world's population lives.”

Thursday, April 14, 2016

The Relationship between Traffic-Related Air Pollution and the Incidence of Parkinson’s Disease

Histological sample of Substantia nigra in Par...
Traffic-Related Air Pollution and Parkinson’s Disease in Denmark: A Case–Control Study (6 page pdf, Beate Ritz, Pei-Chen Lee, Johnni Hansen, Christina Funch Lassen, Matthias Ketzel, Mette Sørensen, and Ole Raaschou-Nielsen, Environmental Health Perspectives, Mar. 1, 2016) 

 Today we review research into the relationship between exposure to traffic-related air pollution and the incidence of Parkinson’s Disease, the second most common neurodegenerative disorder. Results from a large sample over 15 years in Denmark indicates that this exposure increases the incidence of PD.


Key Quotes: 

 “very little is currently known about the effects they [air pollutants] may have on the aging brain. Parkinson’s disease (PD) is the second most common neurodegenerative disorder, engendering great human costs in aging populations ..and recent evidence suggests that air pollution may act on biologic pathways contributing to PD.” 

“In animal experiments, ultrafine particulates from combustion (< 0.1 ÎĽm in aerodynamic diameter)—the main contributor to traffic-related air pollution—were shown to reach the brain, cause inflammation, and act as neurotoxins” 

“To our knowledge, this is the first study to suggest that ambient air pollution due to traffic-related sources increases the risk of PD. This association was observed among those who were born or living in Copenhagen or provincial towns,” 

 “the large sample size of our study together with our exposure assessment techniques covering a very long time span allowed us to conduct an investigation that suggests long-term impacts of air pollution on PD risk"

Tuesday, April 12, 2016

How is Traffic-Related Air Pollution Related to Dementia?

Traffic-Related Air Pollution and Dementia Incidence in Northern Sweden: A Longitudinal Study (7 Page pdf, Anna Oudin, Bertil Forsberg, Annelie Nordin Adolfsson, Nina Lind, Lars Modig, Maria Nordin, Steven Nordin, Rolf Adolfsson, and Lars-Göran Nilsson, Environmental Health Perspectives, Mar. 1, 2016)

Today we review research which assessed the exposure of a cohort of elderly patients (79-81 years old) to traffic related air pollution (represented by NO2) in a northern Swedish city. Conclusions included observed associations between dementia incidence and local traffic pollution. The magnitude of the association was similar for both Alzheimer’s disease and vascular dementia. The importance of further research is underlined by the predicted tripling of Alzheimer’s Disease over the next 40 years unless preventive measures are taken.

 sweden dementia no2  

Key Quotes:

“to assess the association between long-term exposure to traffic-related air pollution and dementia incidence in a major city in northern Sweden” “there is a growing body of evidence indicating that air pollution causes neuropathological effects and central nervous system disease”

 “Within the next 40 years, the prevalence of Alzheimer’s disease (AD) is expected to triple unless preventive measures are developed” “As early as 1970, it was reported that mental efficiency decreased when adults tested in London were breathing air pumped from the street as opposed to clean air”

“UmeĂĄ is a city with very low regional background levels of air pollution, but there are strong gradients within the city, and yearly violations of the NO2 limits are reported to the Swedish Environmental Protection Agency and the European Environmental Agency.”

 “The major source of our exposure measure, NOx, was vehicle exhaust from local traffic. However, road dust shares the same patterns as those of NOx and exhaust particles in Sweden”

 “We observed associations between dementia incidence and local traffic pollution that remained after adjusting for known risk factors. The magnitude of the association was similar for both AD and VaD ( Alzheimer’s disease and vascular dementia)”

Thursday, April 7, 2016

What does the 2 Deg C Carbon Budget Look Like?

Differences between carbon budget estimates unraveled (Abstract, Joeri Rogelj, Michiel Schaeffer, Pierre Friedlingstein, Nathan P. Gillett, Detlef P. van Vuuren, Keywan Riahi, Myles Allen & Reto Knutti, Nature Climate Perspective, Feb. 24, 2016)

Also discussed here: A lower limit for future climate emissions (International Institute for Applied Systems Analysis (IIASA) News, Feb. 24, 2016) And here: A second look at the two-degree target (International Institute for Applied Systems Analysis (IIASA) News, Dec. 7, 2015)

Today we review research at the International Institute for Applied Systems Analysis near Vienna which examines the conditions necessary to keep global warming within the 2 deg C target accepted by the United Nations Conference COP21 at Paris in the fall of 2015. The limit to the amount of carbon which can be burned (or the available carbon budget) in the future after 2015 has been estimated at varying amounts from 590 to 1240 billion tonnes, a difference of almost a billion tonnes. Differences arise because of assumptions made in various scenarios as well as the contributions by other greenhouse gases than CO2. The possibility of overestimating the budget by up to a billion tonnes is a major concern in terms of the urgency to reduce carbon emissions in action plans for the immediate future. 2degworld

Key Quotes:

"researchers propose a limit to future greenhouse gas emissions—or carbon budget—of 590-1240 billion tons of carbon dioxide from 2015 onwards, as the most appropriate estimate for keeping warming to below 2°C, a temperature target which aims to avoid the most dangerous impacts of climate change”

“A global climate target will always be a political goal, not a scientific one…Even at two degrees of warming there will be consequences and impacts, and science alone cannot say what level of climate change should be considered safe by society.”

“In order to have a reasonable chance of keeping global warming below 2°C, we can only emit a certain amount of carbon dioxide, ever. That’s our carbon budget…This has been known for about a decade and the physics behind this concept are well-understood, but many different factors can lead to carbon budgets that are either slightly smaller or slightly larger. We wanted to understand these differences, and provide clarity on the issue for policymakers and the public.”

“This study shows that in some cases we have been overestimating the available budget by 50 to more than 200%. At the high end, this is a difference of more than 1000 billion tons of carbon dioxide,”

“The researchers identified that the variation in carbon budgets stemmed from differences in scenarios and methods, and the inclusion of other human activities that can affect the climate, for example the release of other greenhouse gases like methane. Previous research suggested that the varying contribution of other human activities would be the main reason for carbon budget variations, but surprisingly, the study now finds that methodological differences contribute at least as much”

Tuesday, April 5, 2016

Can We Reduce Carbon Emissions Enough to Meet Targets or Do We need Technology to Extract It Directly?

The suddenly urgent quest to remove carbon dioxide from the air (Chris Mooney, The Washington Post, Feb.26, 2016)

Also discussed here: Four ways to suck carbon out of thin air (Tim Meko, The Washington Post, Feb. 27, 2016)

Today we review an article that looks at the pros and cons of directly removing carbon from the air, in addition to the various plans to reduce emissions, which will be needed if the world is going to meet the goals (but not action plans) agreed to at the recent COP21 climate conference in Paris. Four approaches are described: Direct air capture, Bioenergy combined with carbon capture and storage, Afforestation and Enhanced weathering. While each can extract some carbon, the question remains if that is enough to meet the challenge which, in simple terms, means comparing the CO2 emissions of 17 tons/year/person (in the USA) with the extraction of a ton/day promised by technology. No question that something is needed in addition to the very modest targets that many countries are planning to reduce emissions at source. No surprise either that pricing carbon use is seen as essential. direct air capture  

Key Quotes:

 “the goals set at last year’s Paris accord on climate change, of keeping the planet’s warming “well below” 2 degrees Celsius, may not be achievable unless such technology comes to fruition.”

 “If you want to balance the books at this point, I don’t think you have a choice but to pull CO2 back that has already made it out…Or is about to make it out, because we are not overnight shutting down all the coal plants.”

“scientists have roughly calculated the remaining carbon “budget” for how much we can emit while still keeping below a 2-degree increase. And it’s extremely tight – well under 1,000 additional gigatons (or billion tons) of carbon dioxide. The world emits about 32 gigatons annually from energy use alone.”

Four ways to extract carbon from air:
  • Direct air capture …Carbon dioxide is pulled out of ambient air using absorptive substances that selectively bind to CO2. A company called Carbon Engineering uses fans to pull air across an absorbant membrane. There, CO2 is converted into a carbonate solution, which can be processed to trap the carbon.
  • Bioenergy combined with carbon capture and storage (BECCS)..Trees or other forms of biomass are burned in power plants and replanted. Power plants capture, compress and send carbon dioxide to sequestration sites, where it is buried or used for enhanced oil recovery.
  • Afforestation …Trees are planted in an area where a forest does not exist. Trees and vegetation consume carbon dioxide as they grow.
  • Enhanced weathering ..Slightly acidic rain falls on silicate rocks and they slowly break down to a carbonate solution. The carbon in the rain eventually winds up embedded in limestone rocks.
“I’m skeptical there is a technology that will cheaply capture CO2 at 400 parts per million when it’s expensive to do at 400,000 parts per million in a smokestack… It’s tougher thermodynamically. Carbon dioxide in air is a thousand times less abundant.”

 “simply planting huge amounts of trees where they currently do not exist, faces a similar hurdle. There’s no doubt more trees means less carbon dioxide in the atmosphere. Yet once again, vast areas could be required — and in the future, people will need even more land to grow food than at present.”

 “With all these technologies and ideas, then, the question becomes how to lower the cost and when the world will truly start investing. A boon to all of them, of course, would be setting a global (or for the U.S., national) price on carbon, thus making its removal more valuable.”