Thursday, February 26, 2015

Do Cholesterol Pills Reduce the Risk of Cardiovascular Disease from Exposure to Particulate Matter?

Statins: Widely used drugs may protect people from air pollution (Brian Bienkowski, Environmental Health News, Nov. 24, 2014)  

 Also discussed here: Chronic PM2.5 exposure and inflammation: determining sensitive subgroups in mid-life women.(Abstract, Ostro B, Malig B, Broadwin R, Basu R, Gold EB, Bromberger JT, Derby C, Feinstein S, Greendale GA, Jackson EA, Kravitz HM, Matthews KA, Sternfeld B, Tomey K, Green RR, Green R, Wnviron Res., May 8, 2014)  

Today we review research into the ways that the drugs taken to reduce cholesterol interact with C-reactive protein to reduce the inflammation that normally is caused by exposure to fine particulate matter. This is important since 1 in 4 adults over 45 take statins (including Lipitor, Zocor and other brand names) and over 800,000 deaths world-wide are caused by fine particles. smart growth cities  

Key Quotes:

“Health impacts from spikes in particulates in the air are substantial. Statins seem to protect not only lungs from these impacts but the heart, too,”

 “a 10 µg/m(3) increase in annual PM2.5 more than doubled the risk of CRP [C-reactive protein ] greater than 3mg/l in older diabetics, smokers and the unmarried.”

 “people who take statins have fewer proteins in their blood that indicate inflammation of tissues… This inflammation may aggravate respiratory and cardiovascular diseases.”

“There are some specific groups [such as diabetics] that seem to have higher levels of inflammation after long-term exposure….On the converse side, we found that people on statins seem to be protected from the inflammatory effects of PM2.5.”

“Health impacts from spikes in particulates in the air are substantial. Statins seem to protect not only lungs from these impacts but the heart, too.”

“The older thinking was that plaque in coronary arteries caused heart attacks….Now the thinking is that it’s also due to some living tissue under plague that gets inflamed and that disrupts the plaque. We already knew statins ameliorate heart disease, and always thought it was through lipids, but here’s a new pathway.”

“Larger effects were also observed among those with low income, high blood pressure, or who were using hormone therapy, with indications of a protective effects for those using statins or consuming moderate amounts of alcohol.”

Tuesday, February 24, 2015

The Future of the World’s Urban Economy and Carbon Emissions

Cities and the New Climate Economy: The Transformative Role of Global Urban Growth (68 page pdf, Graham Floater and Philipp Rode, New Climate Economy Cities Paper 01. LSE Cities, London School of Economics and Political Science, Jul. 2014)

Today we review a report on the future likely for the globe’s urban areas in terms of growth, their increasing share of the world economy, population and greenhouse gas emissions. A “Three C” model is proposed that shows the advantages of cities adopting compact urban growth, connected infrastructure and coordinated governance that already has shown itself in cities such as Stockholm which has seen a 41% economic increase while reducing carbon emissions by 35% over the last 7 years.
 stockholm emissions  

Key Quotes:

“As a proportion of global population, the urban population is expected to reach 60% by 2030, with urban areas growing at a rate of 1.3 million people every week”

Urban sprawl, poor public transport infrastructure and a lack of basic services such as energy, water and waste can hinder accessibility and mobility, increase air pollution and exacerbate urban poverty, reducing the economic benefits of urban concentrations and increasing costs.”

Urban areas are associated with around 70% of global energy consumption and over 70% of energy-related carbon emissions”

“from 2012 to 2030…In total, cities are projected to be responsible for 56% of the global increase in carbon emissions”  

“Urban air pollution is projected to become the top environmental cause of premature mortality by 2050..in 2012 alone, air pollution resulted in around 7 million premature deaths”  

“almost 60% of growth in expected energy consumption is directly related to urban sprawl - more than the consumption related to increases in GDP and demographic changes”

“Due to the long life span of buildings, some have argued that a significant risk exists of locking in around 80% of 2005 global energy use in buildings by 2050 “

“The IPCC estimates that a 20 to 50% reduction in greenhouse gas emissions from urban transport is possible between 2010 and 2050, “ “The 3C model:
  • Compact urban growth: .. encourages higher densities, contiguous development, functionally and socially mixed neighbourhoods, walkable and human-scale local urban environments…
  • Connected infrastructure: .. Bus Rapid Transit, cycle superhighways, electric vehicles, smart grids, energy efficient buildings and essential water, sanitation and waste services….
  • Coordinated governance: …particularly for land-use change and transport.”
“A number of cities are already showing that compact, connected and coordinated urban pathways can go hand in hand with strong economic growth. While Stockholm reduced transport, heating and electricity emissions by 35% between 1993 and 2010 from a low starting point, the city’s economic output grew by 41% over the same period… car ownership in London decreased by 6% between 1995 and 2011, while the city’s economy grew by around 40% “    

Thursday, February 19, 2015

Who is Liable for Damages from Climate Change Impacts?

Payback Time? What the Internationalization of Climate Litigation Could Mean for Canadian Oil and Gas Companies (64 page pdf, Andrew Gage and Michael Byers, Canadian Centre for Policy Alternatives, Oct. 9, 2014)    

 Also discussed here: Climate change may create legal liability for Canadian energy firms - New report from B.C. think-tanks says elements are in place to allow for civil action (CBC News, Oct. 9, 2014)  

And here: Policy Time Line  

Today we review a report from a Canadian policy think-tank which examines the potential for legal action against a handful of Canadian oil and gas producers, because of their contribution to harmful impacts from global climate change, expected to reach $5B/year by 2020. The potential liability of each Canadian company is between $37.8 million and$90.8 million in 2010, rising to over $700M by 2030. Just as it took about 30 years to collect from tobacco companies for harmful impacts to health from the time a warning was given by the Surgeon General of the USA in the late 1960s, so the clock is ticking for those responsible for damages from climate change- and the clock began ticking in 1988 at the Toronto Conference on the Changing Atmosphere, the first major international forum bringing scientists and politicians together in an effort to combat global warming, where 300 international scientists and policy makers from 46 countries issued a warning on climate change whose consequences “could be second only to a global nuclear war”.

Since then, two major factors have changed in terms of environmental liability: much more accurate estimates of financial damages and of emissions have been documented, and the law profession itself has matured and broadened to include the environment as an active and growing area of jurisprudence. In addition, as the report points out, even if the existing body of law does not explicitly identify GHG emissions as a culpable area, courts have been willing to change the law and liability in light of new information, as seen in the tobacco cases. Whether that liability starts and ends with oil and gas producers or extends to those responsible for reducing damages from climate change and the emissions that cause them- such as large municipalities which control traffic and vehicle emissions, public infrastructure and protection of private property from environmental damages, for example, remains to be seen. And then there is the growing awareness of the impacts of climate change which combines with air pollution to increase health costs.

  cdn oil and gas liable

 Key Quotes:

"Humanity is conducting an unintended, uncontrolled, globally pervasive experiment whose ultimate consequences could be second only to a global nuclear war." (Statement from the World Conference on the Changing Atmosphere, Toronto, June 1988).

“For 2010 alone, the global financial cost of private and public property and other damage associated with climate change has been estimated at $591 billion. That number is expected to increase dramatically in the com­ing years. In Canada, the National Roundtable on the Environment and the Economy has estimated that climate change will cost $5 billion annually by 2020. “

“improvements in climate change science, the growing frequency of visible climate impacts and the lack of meaningful international action on climate change are making it increas­ingly likely that courts in countries suffering damage will assert jurisdiction.”

"It's very clear scientifically there is a cause of climate change and there is damage…. Once you have those two elements and you have two separate parties, you have the basis for a civil action."

“five Canadian companies —Encana, Talisman, Canadian Natural Resources, Husky and Suncor — as among the 90 largest emitters on the planet… its percentage of global emissions from 1751–2010 is multiplied by the total global cost of climate change.. the potential liability of each Canadian company is between $37.8 million and$90.8 million in 2010, rising to between $297.9 million and $714.9 million in 2030.”

“Case law in Canada and the United States concerning water and air pollution has long recognized that defendants can be held liable for their “significant” contribution to pollution, even if it only became harmful in combination with other sources of pollution.”

"Rising levels of climate damage, increasing scientific evidence about the links between emissions and the damage they cause, and an emerging public debate about who is financially responsible for this damage, could change the situation very quickly.”

Tuesday, February 17, 2015

Does Air Pollution Cause Kidney Disease?

PULP MILL AIR POLLUTION - NARA - 544999
County-Level Air Quality and the Prevalence of Diagnosed Chronic Kidney Disease in the U.S. Medicare Population (Abstract, page 824, Jennifer L. Bragg-Gresham, Hal Morgenstern, William M. McClellan, Sharon Saydah, Desmond Williams, Neil R. Powe, Delphine S. Tuot, Yi Li,1 Rajiv Saran, American Society of Nephrology, Nov. 11-16, 2014) 

 Also discussed here: Air pollution associated with higher rates of chronic kidney disease (Science Daily, Nov. 16, 2014) 

 Today we review research into the link between air pollution and chronic kidney disease or CKD. Results indicate higher prevalence of the disease with particulate (PM2.5) readings as low as 8.4 μg/m3, much lower than the expected threshold of 40 μg/m3 for elderly patients. Higher incidence of CKD may be expected in countries or regions with higher air pollution levels than where this research was conducted in counties across the USA. 


 Key Quotes: 

“the investigators found a positive association between the prevalence of diagnosed chronic kidney disease [CKD] and county level of particulate matter less than 2.5 micrometers in diameter. This finding remained true after controlling for major patient-level risk factors for chronic kidney disease such as age, diabetes, and hypertension.” 

“An elevated prevalence of CKD was observed when particulate matter levels were as low as 8.4 μg/m3, which is much lower than levels typically considered unhealthy for sensitive groups such as the elderly (~40 μg/m3). "

We found that poorer air quality was associated with higher prevalence of CKD. However, the cross-sectional design and lack of individual exposure data precludes causal inference” 

"If air pollution is a risk factor for CKD, the impact is likely to be even greater in countries where pollution levels are much higher than in the U.S. Future investigations should include lab-based diagnosis of CKD, longitudinal data, measures of multiple air pollutants and individual exposure, and more extensive control of confounding factors,"

Thursday, February 12, 2015

How Cities Can Get to the Three Zeros (Congestion, Pollution and Accidents)

Implementing Transport Policies and Programmes toward Realizing “Bali Vision Three Zeros - Zero Congestion, Zero Pollution, and Zero Accidents towards Next Generation Transport Systems in Asia (58 page pdf, Todd Litman, Eighth Regional Environmentally Sustainable Transport (Est) Forum in Asia, United Nations Centre For Regional Development, Nov. 19, 2014)

 Today we review a background overview paper prepared by one of the world’s leading advocates for sustainable transportation, Todd Litman, at a United Nations conference aimed at developing best practices in Asia where major shifts to urbanization are taking place. His paper includes many tips and statistics such as better traffic congestion indicators and space requirements for various modes, the advantages of transportation demand management strategies, especially when different ones are combined.

 sust transp goals  

Key Quotes:

“cities tend to experience significant traffic and parking congestion problems when ownership rates exceed about 200 vehicles per 1,000 residents.. In most cities traffic congestion maintains equilibrium; it increases to the point that residents fore-go some potential peak-period vehicle trips... Durable congestion reductions require changing the point of equilibrium by discouraging automobile travel and encouraging use of space-efficient travel modes, particularly public transit.”

 “Space requirements tend to increase with vehicle size and speed.. For example, an automobile traveling at 40 kilometers-per-hour (Km/h) requires about 3.0 meters of lane width and 18 meters of lane length, or about 54 square meters of road space, but at 100 Km/h it requires 4 meters of width and 40 meters of length, or about 160 total square meters. A bus requires about three times a much road space … but during peak periods typically carries 30-60 times as many passengers ... Bicycles and automobiles also require space for parking, ranging from about 2 square meters for a bicycle to 40 square meters for a large off-street parking spaces”

Public transit service improvements designed to attract discretionary travelers (people who would otherwise drive) are particularly effective at reducing urban traffic congestion … These become more effective if implemented with incentives to discourage peak-period automobile travel, such as efficient road and parking pricing and commute trip reduction programs.”

 “Transit travel has about a tenth the traffic casualty rate per kilometer as automobile travel, and many factors that encourage transit travel (better walking and cycling conditions, lower traffic speeds, more compact and mixed development) also help increase traffic safety. “

 “wider roads may help reduce traffic congestion, and more fuel efficient vehicles may help reduce air pollution, but these strategies tend to increase total vehicle traffic, a rebound effect, which reduces their net benefits and exacerbates other problems. Similarly, grade separated intersections and wider clear zones may help reduce some types of crashes, but they increase roadway costs, and automobile occupant protection such as heavier vehicles and airbags tend to increase production costs and fuel consumption.”

Transportation demand management strategies tend to have synergistic effects: their benefits are greater if implemented together…by itself a bus service improvement might only reduce automobile commuting by 10%, and by itself parking pricing might only reduce automobile commuting 10%, but if implemented together they reduce automobile commuting 30% because they provide both a push and a pull to shift mode. “

Tuesday, February 10, 2015

What is China Doing about Urban Air Pollution?

China’s clean air challenge: The health impacts of transport emissions (Su Song, The City Fix, Nov. 20, 2014)

Also discussed here: In Step to Lower Carbon Emissions, China Will Place a Limit on Coal Use in 2020 (Edward Wong, New York Times, Nov. 20, 2014)

Today we review plans by the Chinese government to both monitor and reduce the extremely high levels of air pollution found in its largest cities, a large portion of which is due to vehicle emissions. Plans have been approved to achieve particulate emissions by as much as 25% by 2017 by monitoring emissions and using technology to regulate them and by managing transport demand using congestion pricing and other economic tools. Equally impressive plans are in place to cap carbon emissions from coal by 2020. Credit must be given to governments that recognize the impact of unrestricted deterioration of urban air quality on health and then proceed to establish short and longer term targets to improve this. When will Canadian and American governments (and City Councils) do likewise for their cities or do we wait until conditions get as bad as in China?

China-transport-air-pollution-car-ownership-income-growth  

Key Quotes:

“only 4.1% of the 74 surveyed cities met the new standards for fine particulate matter (PM2.5) emissions. … more than one billion Chinese people exposed to air quality considered unsafe for more than half of the year with a concentration 26 times above the WHO standard for safe exposure at 671μg/m3. “

 “Motor vehicles are estimated to emit about 15-35% of local PM2.5 in Chinese cities…Vehicle emissions also account for 58% of the nitrogen oxides (NOx), and 40% of volatile organic compounds (VOC) in Beijing – both of which can have serious negative health effects.”

“In a congested area where vehicles frequently stop and go, tailpipe emissions can be three times higher than when driving is smooth. For example, on Beijing’s west second ring road, PM2.5 levels are 25-30μg/m3 when traffic is moving freely compared to 90-100μg/m3 during peak congestion.”

 “Various policy instruments can address these challenges:
  • Emissions monitoring and evaluation.
  • Transport demand management (TDM). Various economic instruments like parking management and congestion pricing, together with regulatory instruments such as traffic and vehicle ownership restriction..
  • Technologies and standards. .. stricter emission standards for all kinds of vehicles, especially for vehicles with diesel engines…”
Transit-oriented development (TOD) and public transport. ..Evidence shows that eliminating one car when a household shifts to public transport reduces the household’s emissions by up to 30%. …the indirect “leverage effect” of higher density around transit hubs can amplify the direct emissions reductions from public transit by 200 to 300%.”

 “2017 is the deadline to achieve targets from the Air Pollution Prevention and Control Action Plan, which calls for PM2.5 reduction of 25%, 20%, and 15% for the Beijing-Tianjin-Hebei, Yangtze River Delta, and Pearl River Delta regions”

Thursday, February 5, 2015

Using a Billboard to Clean the Air

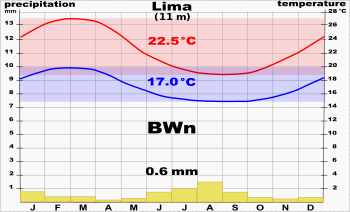
Climate chart for Lima, Peru
Climate chart for Lima, Peru (Photo credit: Wikipedia)
Air-purifying billboard does the work of 1,200 trees (Lakshmi Sandhana, GizMag, May 6, 2014 

 Also discussed here: Peru’s Innovative Air-Purifying Billboard (Courtney Mollenhauer Innovate Development, 19 May, 2014) 


Today we review several articles about a billboard in Lima Peru which scrubs the surrounding air and purifies 100,000 cubic meters of air each day which is equivalent to the purifying effect of 1,200 trees with the cleaner air benefits extending 5 blocks from the location of the billboard. In this case the mechanism was used to clear the air near a heavy construction site where small particulates were being injected into the air- and this example might be used for similar sites in cities elsewhere.


Key Quotes: 

 “it’s employing basic thermodynamic principles — that is, principles related to shifts in temperature, pressure and vacuum — to combine incoming air with water in a mechanism that balances their internal heat. That transaction results in the pollutants (dust, small particles of metal, germs and bacteria) hanging back in the water, effectively scrubbed from the air.” 

“According to the team, a single billboard can do the work of 1,200 trees, purifying 100,000 cubic meters (3.5 million cubic feet) of air daily in crowded cities.” 

 “between March 24-30, 49,800 people benefitted from 489,000 cubic meters of purified air, and that its billboard managed to eliminate 99 percent of the airborne bacteria from that total.” 

“the billboard’s benefits extend to a radius of five city blocks, benefitting both residents and construction workers, and that the water used by the billboard is fully recyclable”

Tuesday, February 3, 2015

Does Traffic-related Air Pollution Cause Teenage Obesity?

English: These children, playing in a public s...
English: These children, playing in a public space, vary in their proportion of body fat. (Photo credit: Wikipedia)
A Longitudinal Cohort Study of Body Mass Index and Childhood Exposure to Secondhand Tobacco Smoke and Air Pollution: The Southern California Children’s Health Study (30 page pdf, Rob McConnell, Ernest Shen, Frank D. Gilliland, Michael Jerrett, Jennifer Wolch, Chih-Chieh Chang, Frederick Lurmann, and Kiros Berhane, Environemntla Health Perspectives, Nov. 12, 2014) 

Also discussed here: Tobacco smoke, roadway air pollution linked to childhood obesity (Science Daily, Nov. 12, 2014) 

Today we review research based on following the weights of several hundred children through their adolescence (from age 10 to 18) and their exposure to second hand smoke and to proximity to air pollution from nearby traffic. The link between smoking by pregnant mothers (in uterus exposure) has long been known to have an impact on the obesity of the child in later life. The researchers conclude that adding exposure to traffic pollution caused a weight gain equivalent to a 6.6% and all of the side effects that go with obesity, including high cholesterol, diabetes, high blood pressure etc. 


Key Quotes: 

Childhood obesity has doubled in children and quadrupled in adolescents in the past 30 years…. Obese youth are more likely to suffer from health challenges, including high cholesterol, high blood pressure, diabetes, bone and joint problems, social stigmatization and self-esteem problems” 

“The study ….shows increased weight gain during adolescence in children exposed to secondhand tobacco smoke or near-roadway air pollution, compared to children with no exposure to either of these air pollutants.” 

"Vehicle miles traveled, exposure to some components of the near-roadway air pollutant mixture, and near roadway residential development have increased across the United States over the last several decades corresponding to the epidemic of childhood obesity" 

“The 2 kg/m2 associated with the combination of SHS [secondhand smoke]with high NRP [near roadway pollution] exposures at age 18 (compared with low NRP and no SHS) were almost half the standard deviation of 5.1. A 2-kg/m2 relative increase in attained BMI is equivalent to a 6 kg (6.6%) increase in body weight in an adult male who is 1.78 m tall and weighs 95 Kg (BMI 30).”