Tuesday, April 14, 2015

Estimating Health Risks from Air Pollution Using Fixed Sites or Personal Monitors

An air quality measurement station in Edinburg...
An air quality measurement station in Edinburgh, Scotland (Photo credit: Wikipedia)
Estimating risk of emergency room visits for asthma from personal versus fixed site measurements of NO2 (6 page pdf, Scott Weichenthal, Patrick Bélisle, Eric Lavigne, Paul J. Villeneuve, Amanda Wheeler, Xiaohong Xu, Lawrence Joseph, Environmental Research, Feb. 2015)

Today we review research from Windsor, Ontario which compared the exposure to NO2 from an Ogawa personal exposure meter to daily exposure estimated from a fixed nearby measurement site, part of the National Air Pollution Surveillance (NAPS) network and in reference to emergency asthmatic cases. Results indicated that next to zero correlation between the two values from a sample of almost 1,000 measurements. The authors concluded that more attention must be paid to how exposure to pollution is estimated for risk estimates in epidemiological studies. This has significant implications for urban air quality network design as
well.


Key Quotes:

“In this study, our aim was to apply a Bayesian measurement error adjustment method that accommodates both a change in scale and measurement error variance to adjust risk estimates from fixed site values to those from personal exposures”

 “In general, the weak correlation between short-term measures of personal and fixed-site NO2 observed in Windsor is consistent with existing evidence and suggests that caution is required when using fixed-site monitors to estimate short-term variations in personal NO2 exposures”

“Our findings suggest that risk estimates based on fixed-site NO2 concentrations may differ substantially from estimates based on personal exposures if the change in scale and/or measurement error is large. In practice, one must always keep the scale being used in mind when interpreting risk estimates and not assume that coefficients for ambient concentrations reflect risks at the personal level.”

Thursday, April 9, 2015

A Check List for Managing Urban Air Quality

Growing Public Health Concerns from Poor Urban Air Quality: Strategies for Sustainable Urban Living (9 page pdf, Bhaskar Kura, Suruchi Verma, Elena Ajdari, Amrita Iyer, Computational Water, Energy, and Environmental Engineering, Apr. 2013)

Today we review a paper that zeroes in on the issue of urban air pollution and its health impacts, identifying which pollutants cause the greatest harm and what to do about that in terms of identifying and controlling pollution sources. Given that a million premature deaths and another million pre-native deaths are linked to urban air pollution, along with 2-5% GDP costs for developed and developing countries respectively, much more attention is needed at the municipal level now.

 urban aq manageemnt  

Key Quotes:

 “more than 1 billion people are exposed to outdoor air pollution annually. Urban air pollution is linked to about 1 million premature deaths and 1 million pre-native deaths each year…is estimated to cost approximately 2% of GDP in developed countries and 5% in developing countries”

“ contribution of these transportation sources to the overall ambient concentration of that particular air pollutant:
• Carbon monoxide (CO) [70% to 90%]
• Hydrocarbons likemethane (CH4), gasoline (C8H18) and diesel vapors, benzene (C6H6), formaldehyde (CH2O), butadiene (C4H6) and acetaldehyde (CH3CHO). [50%]
• Oxides of nitrogen (NOx) - [45% to 50%]
• Greenhouse gases like carbon dioxide [30%] in developed countries and [15%] worldwide.
• Particulate matter ((PM10/PM2.5) - [25%]. In Europe, the average levels for PM10is approximately 40 μg/m3, and in Beijing the average level is 141 μg/m3.
 • Sulfur dioxide (SO2) - [5%]
• Lead– Lead is a toxic metal mainly used as an anti- knocking agent in gasoline (Lead tetraethyl - Pb(C2H5)4) and is also used in batteries (lead dioxide as an anode and lead as a cathode).
 • Odors- Diesel and gasoline engines are the major sources of odors”

“Conceptual urban air quality management approach:
 • Identify sources of air pollution in the immediate urban area..
• identify the specific pollutants that may be released in the air environment
• Conduct preliminary air quality monitoring to identify the concentration ranges for air pollutants.
. • Identify the best monitoring techniques, equipment, and resources needed to understand the short term and long term trends of these pollutants
 • Establish a permanent network of air quality monitoring stations to measure criteria pollutants…
• Develop a database of air pollutant emission quantities from various sources…
 • Evaluate the relationships between the emission quantities and the ambient concentrations under various meteorological conditions
 • Prioritize the sources of air pollution for regulating.
 • developing policies to control emissions and also to make changes in public behavior which may be responsible for poor air quality (traffic; open burning; fuel combustion; others)
 • Develop a decision support system to integrate the ambient air quality data to compute exposures and health risk probabilities..
• Use the data from the decision support system to assist the policy makers, scientists, and the public to achieve the required air quality management goals”

Tuesday, April 7, 2015

How Can Smart Phones Measure Exposure to Air Pollution?

Using Personal Sensors to Assess the Exposome and Acute Health Effects (15 page pdf, Mark J. Nieuwenhuijsen, David Donaire-Gonzalez, Maria Foraster, David Martinez and Andres Cisneros, Int. J. Environ. Res. Public Health, Aug. 6, 2014)

Also discussed here: Variability in and Agreement between Modelled and Personal Continuously Measured Black Carbon Levels Using Novel Smartphone and Sensor Technologies ( Abstract, Mark J Nieuwenhuijsen, David Donaire-Gonzalez, Ioar Rivas , Montserrat de Castro, Marta Cirach, Gerard Hoek, Edmund Seto, Michael Jerrett, Jordi Sunyer, Environ Sci Technol, Jan. 26, 2015)

And here: Researchers detect students are exposed to high levels of air pollution during trips to school (Press Release, CREAL, Jan. 29, 2015)

 Today we review research into the personal exposure of students during the day to air pollution, using a smart-phone and various sensors stashed away in a backpack carried by the students. Results indicates that pollution levels on the way to school were twice as high as at home largely because of the closer proximity to vehicle emissions.

  cell phone aq    

Key Quotes:

“found that levels of air pollution were more than twice as high during the journeys to school (2.8 microgram/m3) than at home (1.3 microgram/m3) and the levels at school were slightly higher than at home (1.3 microgram/m3) in the city of Barcelona”

“we found considerable variation in the black carbon levels during the day with the highest levels measured during commuting periods (Geometric mean=2.8 ug/m3) and the lowest levels at home (Geometric mean=1.3 ug/m3)”  

"for the first time we used novel smartphone apps (now only used for research but in future can be downloaded for everyone) and sensor technology to measure positioning, physical activity and air pollution simultaneously in children and the results show that air pollution levels are quite variable during the day".

"when children are closer to cars during journeys to school their air pollution levels increase significantly. Also when they are at school during the day their air pollutions are higher than at home, probably because there are more cars around during the day."

"smartphone and sensor technology is developing rapidly and it becomes now easier for people to carry with them a range of sensors to measure their environment and health parameters. This could be used for disease prevention. People can see where there are hotspots of air pollution and avoid them if they want."

Thursday, April 2, 2015

Is there a Link between Air Pollution and Stress?

Associations between air pollution and perceived stress: the Veterans Administration Normative Aging Study (23 page pdf, Amar J Mehta, Laura D Kubzansky, Brent A Coull, Itai Kloog, Petros Koutrakis , Avron Spiro III, Pantel Vokonas, Joel Schwartz, Environmental Health, Jan. 27, 2015)

Today we review research conducted in the Boston area with white older men whose exposure to air pollution was averaged over one to 4 weeks over a period of 12 years and compared with a stress index, Perceived Stress Scale, for the previous week. Stress has been found to be associated with depression and depression with a greater risk of heart disease and death. Results indicate a strong association with the vehicle emissions, such as PM 2.5 and nitrogen dioxide (NO2), particularly in colder months of the year,  when higher admissions to emergency for depression take place.

 stress and AQ  

Key Quotes:

“Perceived stress has been linked with increased likelihood of biological dysregulation including inflammation …and greater risk of cardiovascular disease and premature mortality... Both social and physical determinants (e.g., socioeconomic status, noise, crowding), of perceived stress have been evaluated …and it is also hypothesized from earlier studies that the association between air pollution and depression may be mediated by perception of air quality”

“Air pollution was associated with higher levels of perceived stress in this sample of older men, particularly in colder months for specific pollutants.”

 “Fine particles (PM2.5), black carbon (BC), nitrogen dioxide, and particle number counts (PNC) at moving averages of 1, 2, and 4-weeks were associated with higher perceived stress ratings”

“Notably, PNC, BC, and NO2 are all traffic pollutants, suggesting that traffic emissions, and particularly fresh ultrafine particles, are the principal source of these associations.”

“a multi-city time series analysis demonstrated that same-day increases in air concentrations of carbon monoxide, and NO2 during warm months, and PM10 during cold months were associated with more emergency admissions for depression. If air pollution increases perceptions of stress, and higher levels of stress trigger more depressive symptoms and episodes, this may be one pathway by which air pollution alters depressive status.”

Tuesday, March 31, 2015

How Will Europe Meet its 2030 Renewable Energy Goal?

Implementing the EU 2030 Climate and Energy Frame-work – a closer look at renewables and opportunities for an Energy Union (14 page pdf, Anne Held, Mario Ragwitz; Gustav Resch, Lukas Liebmann, Fabio Genoese, Intelligent Energy - Europe, ALTENER, Dec.8, 2014)

 Today we review a discussion paper that examines the changes facing the EU in achieving a 27% increase in the share of renewable energies while also reducing greenhouse gas emissions by 40 % before 2030, only 15 years away. Among the factors considered are the declining need for energy efficiencies or at least for financial renumeration as technology improves and matures, the need for states within the EU to consider implementing joint or regional plans to take advantage of and lessen negative impacts of border states. EU renew energy  

Key Quotes:

“This framework includes binding targets for (i) domestically reducing greenhouse gas emissions by 40% until 2030 compared to 1990 and for (ii) increasing the share of renewables to 27%. Finally, there is an indicative target to improve energy efficiency by at least 27% compared to “business-as-usual” projections of the future energy demand.”

“Assuming a share of 27% renewables in 2030, between 500 and 910 TWh of additional renewable energy will have to be deployed in the decade from 2020 and 2030, depending on the level of final energy demand… These are the net figures, which do not consider potentially needed replacements of older renewable energy “

 “A stronger decline of energy demand corresponding to a 30% energy efficiency target would lead to the lower boundary, while moderate energy efficiency measures (leading to energy demand savings of 21% compared to baseline) combined with no dedicated support for biofuels beyond 2020 may lead to an increase of additional net deployment of renewables in the electricity sector when compared to the decade from 2010 to 2020. When considering gross instead of net figures, the difference between this and the upcoming decade is even more striking: the additional amount of renewable electricity between 2020 and 2030 would have to remain at least on the same level as in this decade but might also have to increase by up to 46%”

“the analysis indicates a strong decline in remuneration levels for renewables over the whole assessment period as a result of expected technological progress across all key renewable technologies. This positive trend is driven by cost reductions for onshore and offshore wind as well as solar photovoltaics, which are expected to be the dominant renewable energy technologies in the power sector beyond 2020.”

“.. instead of single EU member states pledging themselves to a national target, groups consisting of several EU member states could pledge themselves to a joint or regional target. This implies to gradually move beyond strictly national energy policies towards a more co-ordinated approach as part of a broader EU vision.”

 “a common understanding on these cross-border effects enables the cooperating member states to design action plans and policies seeking to maximise beneficial cross-border effects and fairly share the burden of unfavourable ones across all affected parties.”

Thursday, March 26, 2015

How Has Germany Improved Its Air Quality?

Clean Air – Made in Germany (50 page pdf, Federal Environment Agency of Germany, Nov. 2014)

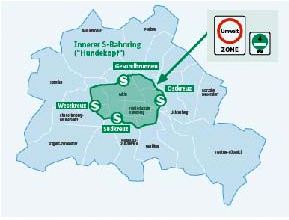
Today we review measures undertaken by the national and municipal governments of Germany over the last decade or two to reduce air pollution particularly in its cities and particularly from transportation although initiatives are also in place to deal with wood combustion and ammonia from emissions from agriculture. Specific measures include Low Emission Zones and application of road pricing, restrictions for parking and lower speed limits of 30 kph on major roads. The result is that air quality in German cities today are as high as in rural areas 20 years ago. Future challenges include reducing greenhouse gas emissions to meet EU targets and reducing NO2 and PM emissions from diesel powered vehicles.

 low emission zones berlin  

Key Quotes:

“The German government bases air pollution control on four strategies:
  • laying down environmental quality standard
  • emission reduction requirements according to the best available technology
  • product regulations
  • laying down emission ceilings”
“Air quality in German cities is as high as the air quality in rural areas 20 years ago. We reduced carbon monoxide (CO) by 90 per cent, polycyclic aromatic hydrocarbons (PAH) by 90 per cent, benzene by more than 95 per cent, nitrogen oxides by 90 per cent and particulate matter by 70 per cent.”

“these successes were achieved by technologies like flue-gas desulfurization or the use of electrostatic precipitators and catalytic converters… enforced by emission standards, which are now mainly implemented at European Union level”

“the responsibility to meet air quality levels enables local or regional authorities to set up air quality plans containing various measures to improve air quality. Well-known examples for local measures are Low Emission Zones, which exclude vehicles with low emission standards from areas within the zone…. Lorry per toll rates in Germany vary between €0.14 and € 0.29 per km depending on environmental performance.”

“The Convention on Long-range Transboundary Air Pollution is an example how states can cooperate to reduce air pollution. Commitments not to emit more than a given total amount of a pollutant are instruments which can be used within these international conventions.”

“Beside the reduction of emissions from classical sectors like traffic and industrial plants, several other fields of action have been identified. These include the reduction of particle emissions from non-road mobile machinery and domestic wood combustion as well as the reduction of ammonia emissions from agriculture”

"A municipal air quality plan comprises all emissions sources like transport, industry, power generation and households.Based on emission and exposure models of the two main pollutants PM and NO2 , air quality measures are derived…the most important component is to make car transport less attractive by means of e.g. speed limits, restrictive parking management and pricing schemes.”

“Low Emission Zone (LEZ): Reduction potentials to reduce concentration levels for LEZs highly depend on the level of access restriction. Evaluation studies of actual LEZ implemented in the years 2008–2011 result in reduction potentials of up to 10 % for NO2 , 7 % for PM10 and 10 % for PM2.5 . A high reduction potential of up to 19 % for soot (black carbon) is particularly mentioned”

“Speed limits of 30 or 40 km/h on major roads ..Reducing speed limits on major roads from 50 to 30 or 40 km/h is a measure that is especially difficult to quantify. For the additional concentration caused by road traffic, reduction potentials for road traffic of 18 % for NOX , 15 % for NO2 and 30 % for PM10 are given.”

“What are the remaining challenges and priorities for Germany?
  • climate change, in this area we still have a lot to do with regard to the further reduction of CO2 as well as of short-term climate factors like black carbon, soot, fluorocarbon or methane.
  • problems with the amount of particulate matter.
  • ·        especially in urban canyons we have problems with nitrogen dioxide (NO2 ) emitted by diesel-powered vehicles because of wrong incentives and misguiding regulations are still in place.”

Tuesday, March 24, 2015

What are the Costs and Benefits of Renewable Energy?

The Net Benefits of Low and No-Carbon Electricity Technologies (38 page pdf, Charles R. Frank, Jr., Global Economy and Development Working Paper 73, Brookings Institute, May 2014)

Today we review a research paper that examined the costs and benefits of various non-carbon energy sources, as opposed to oil and gas alternatives, under a number of carbon tax scenarios. Several factors are clear: the benefit of a stable base power or capacity as seen in either natural gas or nuclear outweigh the much lower carbon emissions from solar and wind- to the point that with a $100 per ton carbon tax, nuclear is the favoured option over wind and solar at #4 and #5. If the carbon tax is lower, solar and wind benefits are much much lower than from the other fuel sources. The case for a higher carbon tax is clear if any hope of reducing carbon emissions is to be satisfied.

 cost of renewable energy  

Key Quotes:

“It estimates the costs per megawatt per year for wind, solar, hydroelectric, nuclear, and gas combined cycle electricity plants”

“one of the main benefits of renewable energy plants is the energy cost avoided in the displacement of fossil fuel electricity production. Nuclear plants do have an energy cost. However, the energy cost of a nuclear plant is much lower than that of a fossil fuel electricity plant that it displaces.”

 “Wind, solar, and hydroelectric plants without storage are inher­ently less reliable, not because they are mechanically more prone to forced outages, but because the avail­ability of wind, sun or water is highly variable. …a wind plant with a 30 percent capacity factor can actually replace only less than a third of a coal plant with a 90 percent capac­ity factor“

“Nuclear plants have far and away the highest capacity cost. Gas combined cycle plants have far and away the lowest capacity cost” “[at $100 per ton carbon tax] A new nuclear plant becomes the most favored alter­native. Wind and solar continue to rank fourth and fifth among all the alternatives, mainly because of the very high capacity cost and the very low capacity factors.”  

Key Findings:

*reductions in carbon emissions are valued at $50 per metric ton and the price of natural gas is $16 per million Btu or less—nuclear, hydro, and natural gas combined cycle have far more net benefits than either wind or solar.
*low and no-carbon energy projects are most effective in avoiding emissions if a price for carbon is levied on fossil fuel energy suppliers. .. The price of carbon should be high enough to make production from gas-fired plants preferable to production from coal-fired plants..
*direct regulation of carbon dioxide emissions of new and existing coal-fired plants… can have some of the same effects as a carbon price in reducing coal plant emissions..a price levied on carbon dioxide emissions is likely to be a less costly way to achieve a reduction in carbon dioxide emissions.

“It is likely to be far less costly to achieve reductions in carbon dioxide emissions through an effective carbon trading system that allows the market to determine the most effective way to reduce emissions rather than through establishment of EPA standards for emissions.”