Showing posts with label safety. Show all posts

Monday, June 23, 2014

How do Lower Speed Limits Save Lives?

Dangerous by Design 2014 (48 page pdf, Smart Growth America - National Complete Streets Coalition, May 20, 2014)

Also discussed here: Paris to limit speeds to 30 km/hr over entire city (World Streets: The Politics of Transport in Cities, May 21, 2014)

And here: Oops! What went wrong with "Old Mobility" (World Streets: The Politics of Transport in Cities, Jun. 6, 2010)

Today we review a report from a non-governmental organization which aims to make streets safer for everyone, but particularly children and seniors. Children cannot see cars coming when travelling at more than 20 mph and, because they are small, drivers cannot see them either, making this segment of our population vulnerable. Seniors and those who have difficulty walking quickly are killed by cars at almost twice the rate as their part of the population (21% vs 12.6 %). Speed kills and many arterial roads encourage speeding – the risk of death of hit by a car moving at more than 50 mph is 75% while that drops to 6% at 20 mph.

Streets can be designed to protect pedestrians- by removing lanes, by giving pedestrians clearly marked areas to cross, by enforcing reduced speed limits. The Mayor of Paris, France proposes to forbid driving above 30 kph (about 20 mph) on all city streets, with a few exceptions, which tells you two things: first, their society is aging faster than in US/Canada and, second, the city fathers (or in this case mother) put a greater priority on pedestrian safety then on motorized mobility (the French call that “the old mobility”).
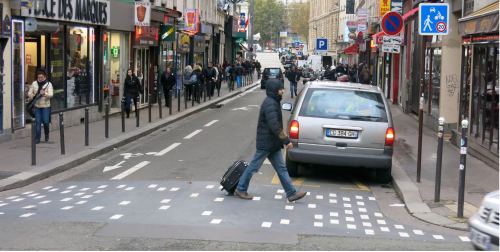
 france-zone-de-rencontre-street 

Key Quotes:

“At 20 mph, the risk of death to a person on foot struck by the driver of a vehicle is 6 percent. At 30 mph, that risk of death is three times greater. And at 45 mph, the risk of death is 65 percent—11 times greater than at 20 mph. When struck by a car going 50 mph, pedestrian fatality rates are 75 percent and injury rates are more than 90 percent“

“Where the posted speed limit was recorded, 61.3 percent of pedestrian fatalities were on roads with a speed limit of 40 mph or higher. This figure compares to just 9 percent of fatalities that occurred on roads with speed limits less than 30 mph.”

“The majority of pedestrian deaths occur on arterial roadways, planned and engineered for speeding automobiles with little consideration for the diversity of people—young, old, with and without disabilities, walking and bicycling—who rely on these streets to get them from point A to point B.”

“The nation’s older population will nearly double in size in the next 30 years. The number of racial and ethnic minorities is also projected to grow significantly. These groups, along with children, are disproportionately represented in pedestrian deaths.”

 “The most common cause of traumatic brain injury for children aged 5 to 9 is pedestrian injury… A recent study of perceptions of children aged 6 to 11 found that they lack the ability to detect vehicles moving faster than 20 mph. They don’t see the cars coming”

“While comprising 12.6 percent of the total population, adults aged 65 and older account for nearly 21 percent of pedestrian fatalities nationwide from 2003 to 2010.. For those 75 and older, pedestrian fatality rates are even more alarming, with 3.96 fatalities per 100,000 capita.15 People aged 75 years and older account for six percent of the total U.S. population, but more than 12 percent of pedestrian fatalities.”

“Generally, designing for safe, walkable communities begins with understanding how people use— and want to use—streets and public spaces to access destinations. From there flow general considerations such as separate people walking from people driving vehicles; keep traffic speeds low; ensure all sidewalks and curb ramps are accessible to people with disabilities; and clarify where each road user should be expected to travel.”

 “The just-elected new Mayor of Paris, Madame Anne Hidalgo, has prepared a revolutionary sustainable mobility project whereby virtually all of the streets of the city will be subject to a maximum speed limit of 30 km/hr….The only exceptions in the plan are a relatively small number of major axes into the city and along the two banks of the Seine”

Monday, March 3, 2014

How Can We Protect Pedestrians from Drivers?

Jaywalk This Way - For New York City pedestrians, following the law can get you killed.(Nicole Gelinas, City Journal, Jan. 24, 2014)

Also discussed here: The New York City Pedestrian Safety Study & Action Plan(New York City Department of Transportation, Aug. 2010)

Today we review a short article from New York City that looked at the counter -productive approached used there (and in most cities) of going after jaywalkers rather than drivers of private cars. Facts show that inattentive drivers and speeders are the biggest causes of crashes that kill pedestrians and older pedestrians in particular. Such measures as red light cameras, speed bumps and just keeping track of and controlling drivers in these “accidents” have brought traffic fatalities down putting New York City as the safest city in the USA (with 3.5 fatalities per 100,000 pop., compared to Chicago at 6 and Atlanta at 11) and Stockholm, Sweden (with 1.2 fatalities) as the safest in the world- possible only with application of a wide range of efforts. Only by making streets safe for walking (and cycling) will cities shift from ones congested with traffic and air pollution to healthier ones. pedestrians and drivers  

Key Quotes:

“surprisingly, most (57 percent) of deaths at intersections between 2005 and 2009 occurred while the pedestrian was crossing with the signal.”

“senior citizens, while only 12 percent of the population, comprise 38 percent of pedestrian deaths.”

“2010 report blamed “driver inattention” for more than one-third of deadly or seriously injurious crashes”

“79% of crashes that kill or seriously injure pedestrians involve private automobiles as opposed to taxis, trucks and buses”

“Officers should target drivers who, according to the 2010 report, are disproportionately likely to kill or injure. That means drivers who speed or who recklessly turn. A pedestrian is three and a half times more likely to die if someone hits her at 40 miles per hour rather than at 30”

“In 2008, New York City had a pedestrian fatality rate of 1.8 per 100,000, 15% lower than the average of 12 peer cities.”

“Crashes are also a leading source of years of potential life lost (YPPL) and affect New Yorkers on a scale similar to cerebrovascular disease (strokes, hypertension) and influenza/pneumonia.”

“50% of adults over the age of 50 reported that they could not cross the main roads near their homes safely. Half of the older adults who reported these problems stated that they would walk more if these conditions were improved”

“Speed reducers (commonly known as speed humps) are traffic calming devices designed to slow vehicle speeds to either 20 or 15 mph.”
Enhanced by Zemanta

Friday, July 5, 2013

Health Risks for Highway Workers

Exposure of Highway Maintenance Workers to Fine Particulate Matter and Noise ( Abstract, Reto Meier, Wayne E. Cascio, Brigitta Danuserand Michael Riediker, Annals of Occupational Hygiene, Mar. 15, 2013)<

Also discussed here: Strimmers are worse than motorway traffic (Medical XPress, May 30, 32013)

Today we review an article that looks at the health risks of highway workers exposed to both vehicle emissions from proximity of traffic and the noise and emissions of particles from their equipment- such as from chain saws and jack hammers. Results indicate levels eight times higher than those faced by the average population. More generally, one could suppose that residences close to ongoing highway maintenance in a city environment would also be impacted.

 Freeway to the  Lenny Zakim Bridge

Freeway to the Lenny Zakim Bridge (Photo credit: OhDuranDuran)[/caption]  
 
Key Quotes:

 “They accompanied 18 maintenance workers on 50 working days during tasks such as clearing snow, mending crash barriers, cleaning drains, cutting wood or mowing grass on the motorway central reservation.[in Lausanne, Switzerland]”

“compared to the average population, maintenance workers are exposed to between three and eight times higher particulate levels. In addition, noise levels often exceed the critical level of 85 decibels”

“The highest exposure to fine and ultrafine particles was measured during grass mowing and lumbering when motorized brush cutters and chain saws were used.”

“the use of strimmers or chainsaws and the traffic during maintenance work in tunnels also give rise to noise levels of 90 decibels or more.. Highest noise levels, caused by pneumatic hammers, were measured during paving and guardrail repair.”

 “The quickest way to reduce particulate levels, therefore, is to improve the engines in these machines. This is primarily a challenge for the manufacturers”
Enhanced by Zemanta

Wednesday, June 26, 2013

Protecting Cyclists on Urban Roads

Inventory of Protected Green Lanes(Green Lane Project)  

Also discussed here: Memphis to Add 15 Miles of Protected Bike Lanes(Angie Schmitt , StreetsBlogNetwork, May 23, 2013)

And here: Why Are Some Cities Safer for Cycling?(Pollution Free Cities, Jul. 19, 2011)  

And here: Segregated Bike Lanes(Pollution Free Cities, Oct. 12, 2009)

And here: Who owns the road in Montreal?(Pollution Free Cities, Oct. 3, 2009)

Today we review the progress being made in cities in the US and Canada of protection of cyclists on busy city roads through the addition of “protected” or “segregated” bike lanes which often separate cars from bikes by a raised curb. While Canada’s capital probably has the most and longest segregated bike parks (at 541 km, planned to increase to 2,500 km), many US cities are planning to double the number of protected lanes from the current 103 in the next year. The “Green Lane Project” provides a spreadsheet detailing the location and length of these lanes in each city which can be found by following the links above. The hoped for result would be to reduce the number of injuries and deaths caused by the merging of fast-moving vehicle
 traffic with cyclists.
  seg bike path  

Key Quotes:

“a “green lane,” adds physical separation between moving cars and bikes, such as a curb, parked cars or plastic posts. Between 1874 and 2011, only 62 of these facilities were built nationwide… this number will nearly double to 102 protected green lanes on the ground in 32 U.S. cities by the end of 2012.. by the end of 2013, more than 200 green lanes will be on the ground”

“Memphis embarked on an ambitious campaign to add 55 miles of bike infrastructure.”

 “We’re working hard to make sure we’re not just building quantity, but that we’re building quality bike lanes. We want all our citizens, young and old, to be able to make the choice to bicycle and feel safe and comfortable when doing so. Green lanes are how we’re going to take the next step to make Memphis the most bike-friendly city in Tennessee.”

“Ottawa currently (2008) has 541 km of bike paths, including 258 km off-road paths and is planning on over 2,500 km”

“With 560 kilometres of designated bike lanes built or under construction on the island, Montreal is ahead of the pack among North American cities”
Enhanced by Zemanta

Friday, April 5, 2013

The Future of Urban Roads - Safe, Healthy?

Our Approach to Health and Road Safety(20 page pdf, EMBARQ)

Also discussed here: More Urbanites, More Cars: The Challenge of Urban Road Safety and Health(Claudia Adriazola and Benoit Colin, WRI Insights, Feb. 21, 2013)

And here: What's Next for Sustainable Transport in Cities?(EMBARQ, Jan 31, 2013)

Today we review a report from EMBARQ, a leading advocate for urban mobility, which examined the growth of vehicles in cities and what this means for the future in terms of health and road safety. Among some of the statistics presented is the link between the distance driven each year and road deaths by vehicles- the death rate per 100,000 inhabitants grows sixfold (from 5 to 30) as the distance driven increases from 15 miles/day to 50. If ways can be found to reduce car dependence by making transit cycling and walking more attractive, there would be fewer deaths and cleaner, healthier cities. miles driven and deaths  

Key Quotes:

“with increased urbanization and motorization, road fatalities are expected to become the fifth-leading cause of death by 2030”

“1.2 million people die every year in traffic crashes worldwide and 90 percent of deaths happen in low and middle-income countries. Almost half of these deaths are pedestrians, bicyclists and motorcyclists”

“By 2050, 70 percent of people are expected to live in cities. At the same time, the number of cars – too often a symbol of individual success – is set to hit 2 billion worldwide by 2020 if we stay on a business-as-usual track.”

“We have to start looking at other ways to move people. Traffic does hurt your economy,”[Mayor Bloomberg, Jan 18, 2013] “When cities grow horizontally, commuting distances lengthen, subsequently increasing traffic fatalities (among other unfortunate effects like air pollution, loss of physical activity, and congestion). Cities need to stay compact and people-oriented rather than car-oriented. “

“According to the World Health Organization, 1.3 million deaths occur each year from the effects of urban outdoor air pollution, with vehicles being one of the major emitters of deadly pollutants, such as fine particulate matter (PM2.5).”

 “EMBARQ is conducting health impact assessments on several projects around the world, that can lead to solutions in fostering fewer traffic crashes, physically active residents and reduced air pollution.”

“[in New York City]After the conversion to a pedestrian plaza, NO pollution levels in Times Square went down by 63 percent, while NO2 levels went down by 41 percent.”
Enhanced by Zemanta

Friday, November 16, 2012

Why does Germany have More Sustainable Transportation?

Sustainable Transport that Works:Lessons from Germany(34 page pdf, Ralph Buehler, John Pucher, World Transport Policy & Practice, Apr. 2009)

Also discussed here: Demand for Public Transport in Germany and the USA: An Analysis of Rider Characteristics(27 page pdf, Ralph Buehler and John Pucher, Transport Reviews, Sept. 2012)

And here: Making Urban Transport Sustainable: Lessons from Europe and North America( Keynote speaker, Dr. Ralph Buehler, Carleton University, Oct. 18, 2012)

And here: City considers cuts to Bronson Ave. speed limit after fatal crash (Ottawa Sun, Nov. 2, 2012)

And here: Who owns the road in Montreal?(Pollution Free Cities, Feb. 11,2011)

Today we review a paper authored by Prof Buehler and John Pucher who have also published a book very recently about safer cycling in cities. The paper compares the degree of sustainable transportation in Germany to the USA and other countries and notes that “The USA is perhaps the best known example of unsustainable transport” for a number of reasons, ranging from much greater support for public transit as well as progressive land use and taxation policies in Germany that result in much less use of cars for commuting (5 times greater use of transit), as well as 2-3 times fewer traffic casualties and 80% fewer cycling casualties. Virtually all German cities have car-free zones and few have motorways that penetrate into the city core (unlike 99% of the large urban areas in the USA and Canada).

It is somewhat telling that shortly after an evening presentation on sustainable transportation by Prof Buehler at Carleton University in Ottawa, a student cycling home (perhaps after attending the presentation) was killed by a car on a 6 lane roadway that links the airport with the city core and lacks a safe bike lane (noting that a segregated bike lane is being piloted downtown and Ottawa currently has over 541 km of bike lanes including 258 km off road and is planning for 2,500 km, more than any other Canadian city).

There are many lessons to be learned here. 


Key Quotes:

“public transport accounts for five times as high a share of trips in Germany as in the USA: 8.5% vs. 1.6%”

 “Per-capita energy use for personal travel fell in Germany by 8.5% between 1999 and 2006, and CO2 emissions fell by 7%. Over the same period, transport energy use per capita rose by 4% in the USA and CO2 emissions rose by 2%”

“Traffic fatalities per capita in 2006 were 2.3 times higher in the USA than in Germany, indicating an important gap in overall travel safety”

Land Us and Taxation policies in Germany that support sustainable transportation:
  • “taxes and restrictions on car use help limit car use and mitigate its harmful impacts.
  • the provision of high-quality, attractively priced, well coordinated public transport services offers a viable alternative to the car for many trips, especially in large cities.
  • infrastructure for non-motorized travel has been vastly improved to increase the safety and convenience of walking and cycling.
  • urban development policies and land useplanning have encouraged compact, mixed-use development, discouraged low-density suburban sprawl and thus kept many trips short enough to make by walking or cycling
  • motor fuel taxes in 2006 were nine times higher in Germany than in the USA…petrol cost about 70% more in Germany than in the USA”
“Even though Germany has the fastest and third largest motorway network in the world, German motorways rarely penetrate into the city centre”

 “roughly 70-80% of the road network in German cities and small towns has speed limits of 30km/hr or less”

 “Virtually all German cities have created car-free zones in their centres, mainly intended for pedestrian use.. Wide sidewalks, safe pedestrian crossings, and car-free zones facilitate pedestrian access to bus and rail stops"

 “the number of cyclist fatalities fell by almost 80% in Germany over the past 35 years, compared to a decline of only 30% in the USA”

 "A reduced speed limit, coupled with increased enforcement, will play a key role in reducing the number of accidents on this stretch of road.. It will also be an important part of implementing some of the expected recommendations of the operation and safety review of this stretch of Bronson Ave. that city staff is undertaking."( Capital Ward Councillor David Chernushenko, Ottawa)
Enhanced by Zemanta