Showing posts with label pedestrian. Show all posts

Thursday, January 26, 2017

What is the biggest influence for commuters to walk, bike or drive a car?

On time and ready to go: An analysis of commuters’ punctuality and energy levels at work or school (Abstract, Charis Loong , Dea van Lierop , Ahmed El-Geneidy, Transportation Research Part F: Traffic Psychology and Behaviour, Dec. 23, 2016)

Also discussed here: Cyclists Are Winning Commuting (Andrew Small, The Atlantic City Lab, Dec. 23, 2016)

Today we review research into commuting choices made by staff and students at McGill University in Canada’s second largest city, Montreal. Although Montreal is hilly and quite cold and snowy in the winter, its cyclists and pedestrians are relatively well served by its city’s administration and policies as reflected in the infrastructure provided for pedestrians and cycling. Montreal has by far the best organized and extensive car free days each year. Montreal was the first city in Canada to have segregated bike lanes in its downtown.

The study of McGill’s commuters reveals that, unlike what most people assume, commuting time per se is not the most important factor- punctuality and feeling energized on arrival are, while noting that the longest time for commutes were those taken by public transit or by private vehicle. If applicable elsewhere (and this may not be valid in cities where infrastructure is poor, where the commuters are older or where winter snow is too much of a barrier), this means that city transportation planners might have to give priority to punctuality and the benefits of arriving refreshed when deciding on improvements for commuters in their cities.

 montreal-cycling  

Key Quotes:

  “analyzed the commuting patterns of the students, staff, and faculty at the school located in downtown Montreal, surveying 5,599 people at the campus in 2013.”

“For the commuters at McGill University, pedestrians had the shortest average commute (about 18.5 minutes), followed by cyclists (23.5 minutes), drivers (32.5 minutes), and transit riders (43.5 minutes).”

“Walkers skewed significantly to younger students, while drivers tended to be older staff and faculty, and cyclists and public-transit riders fell somewhere in the middle.”

 “weather conditions and mode of transportation have significant impacts on an individual’s energy at work and punctuality.”

“drivers have the lowest odds of feeling energized and the highest odds of arriving late for work.” “Cyclists, meanwhile, have the highest odds of feeling energized and being punctual.”

 “satisfaction with travel mode is associated with higher odds of feeling energized and being punctual. With these findings in mind, policy makers should consider developing strategies that aim to increase the mode satisfaction of commuters.”

Tuesday, January 13, 2015

When are You Too Old to Drive?

Is the U.S. Ready for Seniors Who Want to Stop Driving? (Angie Schmitt,Streetsblog, Oct. 27, 2014)

Also discussed here: When Planning for Retirement, Consider Transportation (Harriet Edleson, New York Times, Oct. 17, 2014)

And here: What About The Elderly? (Andrew Price, Strong Towns, Oct. 17, 2013)

And here: Driving Life Expectancy of Persons Aged 70 Years and Older in the United States (6 page pdf, Daniel J. Foley, Harley K. Heimovitz, Jack M. Guralnik and Dwight B. Brock, American Journal of Public Health, Aug. 2002)

Today we review several articles that look at the older generation (getting bigger) and how much they drive (a little less) and how big a challenge it is for them to get around (bigger). One downside is that older drivers are three times more likely to die in a car accident because of their reduced ability to drive, offset by the number who chose not to drive anymore. Some prefer to live in communities where one can walk to get what one needs, even though walking for some is as challenging as driving. Are city planners taking into account the growth of the older population and their differing needs for transportation? As one commentator noted “We cannot ignore the problem, because we will all be elderly one day.”


driving ages  

Key Quotes:

‘The health and longevity of the elderly population in the United States are at unprecedented levels, and many older persons continue to drive throughout their eighth and ninth decades of life… Overall, 82% of the men aged 70 years or older were driving, compared with only 55% of the women.”

“Compared with middle-aged drivers, older drivers have about a 3-fold increased risk of crashing per mile driven. However, older persons drive markedly fewer miles annually than middle-aged drivers, resulting in an equivalent annualized risk for crashing. ”

“Compared with middle-aged drivers of the same sex and involved in the same severity of crash, older drivers are 3 times more likely to die as a result of the crash.. Overall, the mortality rate among male drivers (89 deaths per 1000 drivers) was 62% higher than that among female drivers (55 deaths per 1000 drivers).”

“Americans are outliving their ability to drive safely — a woman, on average, by 10 years, a man by seven.”

“When people make retirement plans, they make no transportation plans because they assume they’re going to drive forever,”

“Nationally, for those over 65, 2 to 3 percent of what distance they travel is on public transportation, 8 percent on foot and the rest by car”

“getting from public transportation to your final destination or walking a mile or more to a bus stop could present an insurmountable challenge, especially on freezing winter days or hot, muggy stretches”

“Those living in households that are car-dependent spend 25 percent of income on transportation. By living closer to work, shopping, restaurants and other amenities, households can reduce transportation costs to 9 percent of their total income.”

“Walkability and access to mass transit are essential factors in housing choice (increasingly for millennials as well as seniors!) and should be considered in any planned development.”

“The majority of Post-World War 2 suburban development has been oriented around the automobile. From the large suburban plots, to the hierarchical street system, to the strip malls and big box stores - they have all been designed with the assumption that everyone drives…. Because nobody walks, there is no real incentive for developers to build sidewalks.”

Monday, June 23, 2014

How do Lower Speed Limits Save Lives?

Dangerous by Design 2014 (48 page pdf, Smart Growth America - National Complete Streets Coalition, May 20, 2014)

Also discussed here: Paris to limit speeds to 30 km/hr over entire city (World Streets: The Politics of Transport in Cities, May 21, 2014)

And here: Oops! What went wrong with "Old Mobility" (World Streets: The Politics of Transport in Cities, Jun. 6, 2010)

Today we review a report from a non-governmental organization which aims to make streets safer for everyone, but particularly children and seniors. Children cannot see cars coming when travelling at more than 20 mph and, because they are small, drivers cannot see them either, making this segment of our population vulnerable. Seniors and those who have difficulty walking quickly are killed by cars at almost twice the rate as their part of the population (21% vs 12.6 %). Speed kills and many arterial roads encourage speeding – the risk of death of hit by a car moving at more than 50 mph is 75% while that drops to 6% at 20 mph.

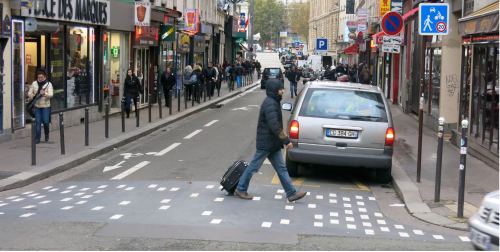
Streets can be designed to protect pedestrians- by removing lanes, by giving pedestrians clearly marked areas to cross, by enforcing reduced speed limits. The Mayor of Paris, France proposes to forbid driving above 30 kph (about 20 mph) on all city streets, with a few exceptions, which tells you two things: first, their society is aging faster than in US/Canada and, second, the city fathers (or in this case mother) put a greater priority on pedestrian safety then on motorized mobility (the French call that “the old mobility”).

 france-zone-de-rencontre-street 

Key Quotes:

“At 20 mph, the risk of death to a person on foot struck by the driver of a vehicle is 6 percent. At 30 mph, that risk of death is three times greater. And at 45 mph, the risk of death is 65 percent—11 times greater than at 20 mph. When struck by a car going 50 mph, pedestrian fatality rates are 75 percent and injury rates are more than 90 percent“

“Where the posted speed limit was recorded, 61.3 percent of pedestrian fatalities were on roads with a speed limit of 40 mph or higher. This figure compares to just 9 percent of fatalities that occurred on roads with speed limits less than 30 mph.”

“The majority of pedestrian deaths occur on arterial roadways, planned and engineered for speeding automobiles with little consideration for the diversity of people—young, old, with and without disabilities, walking and bicycling—who rely on these streets to get them from point A to point B.”

“The nation’s older population will nearly double in size in the next 30 years. The number of racial and ethnic minorities is also projected to grow significantly. These groups, along with children, are disproportionately represented in pedestrian deaths.”

 “The most common cause of traumatic brain injury for children aged 5 to 9 is pedestrian injury… A recent study of perceptions of children aged 6 to 11 found that they lack the ability to detect vehicles moving faster than 20 mph. They don’t see the cars coming”

“While comprising 12.6 percent of the total population, adults aged 65 and older account for nearly 21 percent of pedestrian fatalities nationwide from 2003 to 2010.. For those 75 and older, pedestrian fatality rates are even more alarming, with 3.96 fatalities per 100,000 capita.15 People aged 75 years and older account for six percent of the total U.S. population, but more than 12 percent of pedestrian fatalities.”

“Generally, designing for safe, walkable communities begins with understanding how people use— and want to use—streets and public spaces to access destinations. From there flow general considerations such as separate people walking from people driving vehicles; keep traffic speeds low; ensure all sidewalks and curb ramps are accessible to people with disabilities; and clarify where each road user should be expected to travel.”

 “The just-elected new Mayor of Paris, Madame Anne Hidalgo, has prepared a revolutionary sustainable mobility project whereby virtually all of the streets of the city will be subject to a maximum speed limit of 30 km/hr….The only exceptions in the plan are a relatively small number of major axes into the city and along the two banks of the Seine”

Friday, May 23, 2014

Making Streets Complete for More Mobility

Rethinking Streets - An Evidence-Based Guide to 25 Complete Street Transformations(148 page pdf, Marc Schlossberg, John Rowell, Dave Amos, Kelly Sanford, Sustainable Cities Initiative Oregon, 2013)

Today we review a book that examines street design in 25 varied communities across the USA and how these communities have adapted their streets to a more mobile end result. Each has different needs and as a result different design but all are focused on making the streets more effective, as well as more enjoyable for driving,  walking, transit and cycling.
 street xsection

  Key Quotes:

“No public space works harder than the street. Streets provide vital links to homes and business, and serve as public spaces.“

 “This book documents the redesign of 25 streets across the United States and some of the effects the redesign had on traffic, safety, and economic measures. Each of the streets treats the balance between transportation modes and the balance between thoroughfare and place differently, and the results differ accordingly.”

“Buffered bike lanes are a hybrid design that widens the strip of paint between a bike lane and motorized vehicle lanes. This extra buffer, often 2-3 feet, provides extra space and comfort to a wider range of people on bikes. Like bike lanes, buffered lanes and cycle tracks are generally located on busier streets that have destinations where people want to go.”

 “Streetscape elements like street trees and parked cars increase the “friction” a driver feels. This friction slows down traffic, making the street more pleasant as a place.”

“street designs that include moving curbs often require a greater investment of time and resources.”

“Onstreet parking typically is located next to the curb, although in some cases bike lanes are located between curb and parking to give cyclists protection from moving vehicles.”

“Expanding the right of way can be a complicated, lengthy and expensive process. In order to expand the right of way, the City typically must purchase the land along the roadway from individual citizens and businesses.”

“Auto travel lanes can range from 9-12’ in commercial areas. Current standards recommend minimum 6’ bike lanes.” “Installing streetscape elements can improve the sense of place of a street and create pleasant pedestrian environments.”
Enhanced by Zemanta

Wednesday, May 7, 2014

Is It Time to Get Serious about Reducing the Impact Of Cars on Society?

Is it time for a real war on cars? (David Suzuki Foundation, Apr. 17, 2014)

Also discussed here: It's time for a bigger recall of a seriously defective product: The Car (Lloyd Alter, Treehugger, Apr. 3, 2014)

And here: The Growth of Car Culture (Urban Times, Nov. 2012)

Today we review a provocative article calling for a substantive effort to reduce the number of cars on the road and by doing that reduce the impact that cars have on our health and quality of life. Included in a number of suggestions are the collection of the costs to maintain infrastructure needed for cars and the full costs for health costs caused by cars and the costs for building walkable cities and alternative modes of transportation Revenue for these improvements would come from gas taxes and tolls on roads, bridges and freeways. . Signficant advances in GPS technology and computer communications make the collection of these funds much more feasible, effective and more convenient than ever before, reducing the overhead from over 50% to less than 5%. Time to get serious. death rates from cars  

Key Quotes:

“Cars directly kill and hurt more people every year than most diseases, resulting in 1.5 million deaths and 78 million injuries needing medical care, according to the World Bank. Road injury is the eighth leading cause of death worldwide. Pollution from cars also causes acute and chronic health problems that often result in premature death — from heart disease and stroke to respiratory illness and lung cancer.”

“Environmental impacts of cars are also well-known and wide-ranging, including climate change, smog and oily run-off from roads, not to mention the green space sacrificed for infrastructure to sell, drive, fuel and park them.”

"Since we can't recall every car all at once and redesign the entire country, there are at least things we can do to make it less bad. Significantly reduce speed limits. Make drivers pay the full cost of infrastructure construction and maintenance through the gas tax. Build the cost of medical care for those millions of injured by cars into the price of gas. Invest in walkable cities and alternative forms of transport."

“We take our cars for granted, but really, they haven’t been a part of our human culture for that long, and they needn’t be an essential part forever. – David Suzuki”

"Reinstate the progressive motor vehicle excise tax, hike the gas tax, and toll every freeway, bridge, and neighborhood street until the true cost of driving lies as heavy and noxious as our smog-laden air."

“Presently, more than 500 million cars are being consumed world-wide and this figure is expected to double by 2015“
Enhanced by Zemanta

Monday, May 5, 2014

The Road to Free Public Transit and Fewer Cars

English: Paris, France : station Velib (bike h...
English: Paris, France : station Velib (bike hire service) Place de la Bastille Français : Station Vélib (Système de prêt de vélo) Place de la Bastille, Paris France (Photo credit: Wikipedia)

Today we review a short editorial by Eric Britton’s blog from Paris. He reminds us that the transition from a car addicted sprawled city to one with free public transit and much fewer cars has to be approached in a strategic way through enforcement of regulations and plans that allow or encourage speeding and by planning an urban form that encourages cycling and walking and public transit. At least 5 of the 13 specific measures suggested are needed before proceeding to free public transit along with a clear and public declaration of these steps. Cities such as Paris with its Velib bike sharing program, and Stockholm with its sophisticated congestion charging system, demonstrate how change is possible. Bottom line is for voters to support candidates for City Council who support these measures.


Key Quotes: 

Some steps toward a car freer city: 
• “Strategic parking policy/control/reductions 
• Speed reductions throughout the city and on incoming roads (15/30/50 kph) 
• Systematic reallocation of street space presently available to cars, 
• Road user charges for cars entering built-up areas 
• And never never never build new or expand existing infrastructure to permit greater throughput or higher speeds for private cars.” 

“Any FPT project also needs to be reinforced by a carefully thought out program of incentives and improvements for non-motorized transport in all its many forms. Positive incentives such as Park+Ride, carsharing of course, ridesharing, and the full range of affordable new mobility services.”  
Enhanced by Zemanta