Showing posts with label Air Quality Models. Show all posts

Tuesday, January 27, 2015

Modelling the Dynamics of Traffic Congestion and Urban Air Pollution Hot Spots

MIT Study devises new algorithm to predict traffic patterns (Becca DeGregorio, The Daily Free Press, Nov. 13, 2014)

Also discussed here: Understanding Road Usage Patterns in Urban Areas (6 page pdf, Pu Wang, Timothy Hunter, Alexandre M. Bayen, Katja Schechtner & Marta C. Gonzalez, Scientific Reports, Nature, Dec. 20, 2012)

And here: Phone data helps pinpoint source of traffic congestion (On Balance, Dept. Civil and Environmental Engineering, Massachusetts Institute of Technology, Jan. 2013)

And here: http://www.youtube.com/watch?v=9YDqVBUO3Ps (48 sec You-Tube, Marta Gonzalez, Dec. 8, 2013)

And here: Gridlock Traced to Just a Few Key Commuters (Rocket News, Dec. 21, 2012)

Today we review research from MIT aimed at diagnosing the dynamics of traffic congestion using mobile phone records and population and origin-destination statistics to identify key congested road segments that lead to major congestion across major cities such as San Francisco and Boston. These congested areas rapidly lead to high levels of pollution that affect the entire urban area which puts both drivers and others such as cyclists who use the roads at risk to their health. Better design of the road network and method to reduce traffic peaks such as congestion pricing are offered as solutions.


traffic congestion    

Key Quotes:

 “In 2007 alone, congestion forced Americans living in urban areas to travel 4.2 billion hours more, purchase an additional 2.8 billion gallons of fuel, at a total cost of $87.2 billion”

 “the major usage of each road segment can be traced to its own – surprisingly few - driver sources…in contrast to traditional approaches, which define road importance solely by topological measures, the role of a road segment depends on both: its betweeness and its degree in the road usage network”

“For a road segment, its level of congestion can be measured by the additional travel time te, defined as the difference between the actual travel time ta and the free flow travel time tf. The drivers who travel through congested roads experience a significant amount of te.”

 “the major traffic flows in congested roads are generated by very few driver sources, which enables us to target the small number of driver sources affected by this significantly larger Te.”

“Congestion hot spots can become air quality hot spots within a short amount of time…If you as an individual are stuck in a car and you’re driving in traffic, you’re spending more time being exposed to potentially higher levels of air pollution. The same thing goes for bikers and pedestrians along that roadway.”

 “Ultrafine particles and combusted pollutants from gasoline and diesel fuel are the road’s most common threats to air quality... In urban areas, such as Boston, motor vehicles contribute a large percentage of both.”

“the team could model their algorithm, which aims to prevent inconveniences and environmental stressors triggered by the onset of traffic, based on human destination sites.These sites within the traffic flow prediction formula were then categorized into “absorbers” and “emitters,” with absorbers marking daily locations that draw in large numbers of people — like BU, for example — and emitters marking the places where people live”

Monday, December 31, 2012

Top 10 Posts in 2012 on Pollution Free Cities- Blogger Edition


At year end, bloggers sometimes look back at their posts to see which ones were the most popular- and I did just that with the list of links clipped below, in case you want to revisit any of them. There continues to be interest in pollution-free, sustainable cities and advances being made to reduce or eliminate traffic congestion and pollution in cities, along with an ongoing interest in the health impacts of all this. 


Making Transportation Sustainable in Cities
Comparing the Health Risks of Smoking and Air Pollution
Cities of World Ranked by Exposure to Particulates 

Neural Network Modelling and Residential Building Energy Consumption
How Can Transportation Technology and Practices Reduce Greenhouse Gas Emissions
Economic Impacts of Air Pollution from Asthma 
Climate Change, Air Pollution and Corrosion of Buildings l
Reducing Emissions from Wood Burning Stoves
Childhood Asthma and Ambient Air Pollution


Wednesday, March 7, 2012

Hamilton’s Air Pollution Hot Spots

Mobile Air Quality Monitoring to Determine Local Impacts (39 page pdf, Denis Corr, Rotek Environmental Inc. July 2011)

Also discussed here: Unique study maps neighbourhood air pollution (Hamilton Spectator, Jan. 20, 2012)

And here: A Public Health Assessment of Mortality and Hospital Admissions Attributable to Air Pollution in Hamilton (3 page pdf, School of Geography and Geology and McMaster Institute of Environment and Health, 2011)

From the city of Hamilton, a leader among Canadian cities in the assessment of urban health, comes a report on a local neighbourhood air quality monitoring study. Results indicate almost 12% increased mortality risk as an average across the city for all pollutants, with the highest increased risk (+18%) near the 6 lane highway (403) that bisects the city. The breakdown of risk by pollutant may also be used to identify and reduce pollution sources.


Key Quotes:

“Mobile air monitoring techniques were used to evaluate levels of Carbon Monoxide (CO), Oxides of Nitrogen (NOX), Sulphur Dioxide (SO2), Inhalable Particulate (particulate matter less than 10 microns aerodynamic diameter, PM10) and Respirable Particulate (particulate matter less than 2.5 microns aerodynamic diameter, PM2.5)”

“Of the 11 neighbourhoods monitored, all showed some air pollution impacts, ranging from 6.8% to 18.4% increased mortality, with an overall average of 11.5% increased mortality due to air pollution. The majority of impacts were due to particulate matter and oxides of nitrogen”

“Air quality consultant Denis Corr used a mobile emissions tester to take “pollution snapshots” of 11 neighbourhoods in the city.. “This really is a snapshot of risk..But there is no question people in Hamilton and Ontario are dying (prematurely) due to air pollution”

“People still tend to think about air pollution as primarily a problem associated with industry (emissions). Very few people think about their own car,” (Dr. Chris Mackie, associate medical officer of health for Hamilton)

“The study also showed that the worst place to breathe in Hamilton, by far, is near Highway 403.. highway exposures are far above any neighbourhood mortality values”
Enhanced by Zemanta

Wednesday, June 29, 2011

Improving Knowledge and Communication for Decision Making on Air Pollution and Health in Europe

Aphekom

Also discussed here: Aphekom (Improving Knowledge and Communication for Decision Making on Air Pollution and Health in Europe)

And here:

Traffic Air Pollution and Health Impacts in Urban Italy (Pollution Free Cities, May 20, 2011)

Today’s review article is a summary of the work of the Aphekom project in Europe over the last 3 years. It points to findings which show that living near busy roads (defined as those with typically more than 10,000 vehicles per day) present a significant health risk in terms of reduced life expectancy and health costs.


Key Quotes:

“on average, over 50% of the population in the 10 European cities studied lives within 150 metres of roads travelled by 10,000 or more vehicles per day and could thus be exposed to substantial levels of toxic pollutants”

“on average for all 10 cities studied, 15-30 per cent of exacerbations of asthma in children, acute worsening of COPD and acute CHD problems are attributable to air pollution”

“estimated an economic burden of more than Euro 300 million every year attributable to chronic diseases caused by living near heavy traffic…Our work suggests the total benefits of reducing traffic exposure for urban populations may have been largely underestimated until now"
Enhanced by Zemanta

Monday, April 18, 2011

An Urban Air Pollution Simulator

Smog City
Today’s review is about a computer simulator from California showing ozone levels over a day as a function of population, temperature, amount of cars and trucks, industry etc.


Key Quotes:

“an interactive air pollution simulator that shows how your choices, environmental factors, and land use contribute to air pollution”

“Ozone levels depicted in Smog City are estimated by simulating the air quality over Sacramento, California using a computerized model of the region”

“As each hour of the day passes, emissions from human activities, such as industry, cars, and trucks, and from natural sources like trees and plants, are injected into Smog City's atmosphere.”

“Because Smog City's relationships are based on a simplified model of complex atmospheric processes in Sacramento, California, there is no guarantee that they are scientifically accurate for this or other regions.”

Enhanced by Zemanta

Sunday, February 20, 2011

Air Pollution - Health Effects Methodology


Air pollution
Image via Wikipedia
Case-Crossover Analysis of Air Pollution Health Effects: a Systematic Review of Methodology and Application (47 page pdf, Environ Health Perspect, 31 March 2010)

Key Quotes:

“systematic review of case-crossover (CCO) designs used to study the relationship between air pollution and morbidity and mortality, from the standpoint of methodology and of application..first systematic review to cover the application of case-crossover designs to the study of the health effects of air pollution.“

“The dependent variables most frequently analyzed were those relating to hospital morbidity, while the pollutants most studied were those linked to particulate matter.“

“The papers published by Lee et al. (1999) and Neas et al. (1999) were the first studies to report the relationship between air pollution and mortality, using a CCO design. These studies performed a re-analysis of the effects of air pollution and mortality in the cities of Philadelphia and Seoul, respectively, obtaining a relationship that proved statistically significant.“

“The use of CCO designs has undergone considerable growth, with the most widely used designs being those that yield better results in simulation studies, namely, symmetric bidirectional and time-stratified CCO”
Enhanced by Zemanta

Friday, February 11, 2011

APHEIS

The Apheis project: Air Pollution and Health—A European Information System (14 page pdf, Air Qual Atmos Health, 2009)


Key Quotes:

"Apheis project.. has tracked the effects of air pollution on health in 26 European cities and continues to do so as the new Aphekom project."

"roughly 40,000 people were dying every year from the effects of air pollution in three European countries alone, costing them some €50 billion annually"

"The Apheis public health surveillance system specifically:
  • quantified the effects of air pollution on public health at the local and European levels;
  • assessed the importance of factors that can influence concentration–response (C–R) functions; and
  • delivered standardized, periodic reports on the impact of air pollution on public health."
"This first HIA found that between 500 and 1,000 premature deaths could be postponed annually if, all other things being equal, short-term exposure to outdoor concentrations of PM10 were reduced by 5 ÎĽg/m3 in Apheis cities."

"Apheis also noted that, from a public health perspective, the health impact of daily exposure to air pollution in the long run is greater than the exposure to air pollution peaks"


Enhanced by Zemanta

Friday, November 19, 2010

3D Forecasts of Air Quality – PREV’AIR

PREV’AIR -An Operational Forecasting and Mapping System for Air Quality in Europe (11 page pdf, Bulletin of American Meteorological Society, Jan. 2009)

Also discussed here: PREV’AIR


Key Quotes:

“[French] local authorities in charge of air pollution can now inform the public and take emergency decisions related to air pollution control not only on the basis of measurements, but also by accounting for numerical forecasts”

“three main functions of the PREV’AIR system:

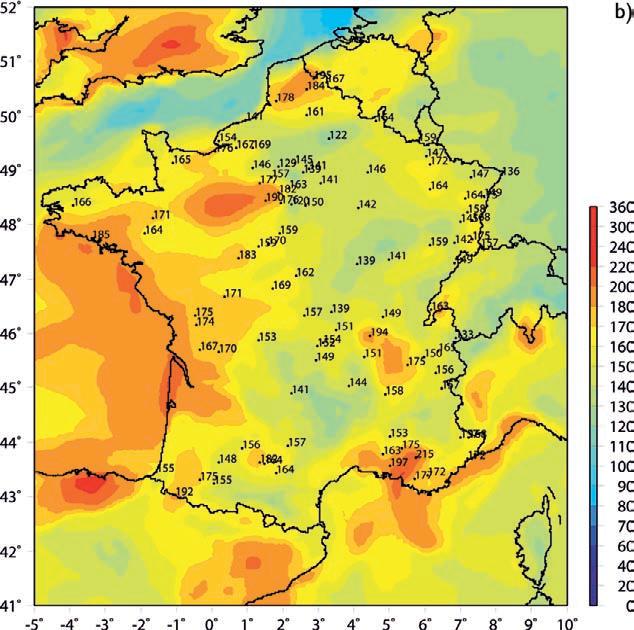
  1. The “forecasting” function delivers forecasted atmospheric concentrations of ozone, particulate matter (PM10 and PM2.5), and nitrogen oxides, simulated throughout Europe at low resolution (0.5° × 0.5°) and over France with a higher resolution (0.15° × 0.1°).

  2. The “analysis” process uses available near-realtime observations to build the “analyzed” maps that are considered as the most realistic description of pollution patterns.

  3. The “performance evaluation” function of the system uses observation data that are routinely acquired for continuous evaluation of the model forecasts, with descriptive indicators given online. Every day, statistical skill scores (bias, errors, percentage of errors lower than a certain level, and correlation) are calculated and updated on the PREV’AIR Web site”


“In case of a pollution episode, when concentrations exceed the regulatory thresholds, PREV’AIR forecasts are broadcast on television channels to enhance public information.“

“system provides real-time information about air pollutant concentrations throughout Europe, with a focus on France, which is particularly relevant to health prevention in acute pollution episodes.“

“Air quality forecasting and mapping is an efficient tool for authorities in charge of air quality management. Anticipating pollution events with concentrations exceeding regulatory levels allows them to inform the general public and to decide emergency control measures.”


Enhanced by Zemanta

Monday, November 15, 2010

Atmospheric Chemistry Processes in Smog Formation

Predicting Smoggiest Days: Experiments Improve Accuracy of Ozone Predictions in Air-Quality Models (Science Daily, Oct. 28, 2010)

Also discussed here: Rate of Gas Phase Association of Hydroxyl Radical and Nitrogen Dioxide (Abstract, Science, Vol. 330. no. 6004, pp. 646 – 649, Oct. 29, 2010)


Key Quotes:

“The reaction of OH and NO2 to form gaseous nitric acid (HONO2) is among the most influential in atmospheric chemistry….We demonstrate the impact of the revised value on photochemical model predictions of ozone concentrations in the Los Angeles airshed.”

“The key reaction in question in this research is between nitrogen dioxide and the hydroxyl radical.. Until about the last decade, scientists thought these two compounds only combined to form nitric acid, a fairly stable molecule with a long atmospheric life that slows ozone formation”

“researchers found the loss of hydroxyl radical and nitrogen dioxide is slower than previously thought-although the reactions are fast, fewer of the radicals are ending up as nitric acid than had been supposed, and more of them are ending up as peroxynitrous acid.”

"a small but significant impact on the predictions of computer models used to assess air quality, regulate emissions and estimate the health impact of air pollution,"

“the laboratory results suggest that, on the most polluted days and in the most polluted parts of L.A., current models are underestimating ozone levels by 5 to 10 percent”

“a 10 part-per-billion increase in ozone concentration may lead to a four percent increase in deaths from respiratory causes-any increase in expected ozone levels will be important to people who regulate emissions and evaluate health risks”


Enhanced by Zemanta

Friday, November 12, 2010

Modelling Air Quality in an Urban Canyon

Estimation of CO concentrations for an urban street canyon in Ireland (8 page pdf, Air Quality, Atmosphere & Health, Mar. 5, 2010)


Today’s review article looks at the performance of two canyon air quality models – STREET and OSPOM – when compared with stationary monitor located near a busy roadway in Dublin. In addition an assessment is made using emission factors (HEF for hourly and CEF for Composite) to judge the models as to the emissions from the source

Key Quotes:

“The WHO has estimated that 1.4 billion urban residents in developing countries breathe air in which pollutant concentrations exceed WHO air quality guidelines (WHO 1992). Urban air pollution episodes are associated with sudden incidences of high concentrations of pollutants, which are generally governed by local meteorology, emissions and dispersion conditions (Mayer 1999). The major source groups responsible for urban air pollution are primarily motor traffic and industries”

“In most European cities, traffic is the most important source of air pollution, with the highest ambient concentrations often found on streets in urban centres. Vehicular pollution dispersion models are therefore essential computational tools for predicting the impacts of emissions from road traffic”

“two urban street canyon models, namely STREET and Operational Street Pollution Model (OSPM), were investigated at Pearse Street, an important traffic route in the centre of Dublin city”

“Hourly background concentrations were obtained from an urban air quality monitoring station.. approximately 100 m from the nearest trafficked street. All this recorded parameters were used in computing the modelled CO concentrations. These were then compared with measured CO concentrations”

“An emission factor is the relationship between the amount of pollution produced and the amount of raw material processed or burned. For road traffic, it is the relationship between the amount of pollution produced and the number of vehicle kilometres travelled (grams per kilometre). By using the emission factor of a pollutant and specific data regarding quantities of materials used by a given source, it is possible to compute emissions for the source”

“This paper tries to highlight the STREET model as a suitable screening model for the prediction of CO concentrations in an urban street canyon. When compared with monitored data, concentrations calculated using STREET and OSPM both successfully predict observed variations in air quality”


Enhanced by Zemanta

Thursday, November 11, 2010

Neuro-fuzzy Urban Air Quality Modelling


Haze over Kuala Lumpur.
Image via Wikipedia


Adaptive neuro-fuzzy modeling for prediction of ambient CO concentration at urban intersections and roadways (10 page pdf, Air Quality, Atmosphere & Health, May 19, 2010)

Modelling of urban air pollution has developed from purely statistical to deterministic but today’s article focuses on neuro-fuzzy techniques which bridges the use of “expert” modelling techniques from artifical intelligence research to estimate extremes as well as average concentrations- in this case, for carbon monoxide at the street/intersection level.


Key Quotes:

“There has been a substantial growth in road traffic over the years and that has resulted in increase in air pollution. In many cities across Europe, USA, Japan, China, and Singapore, vehicular exhaust emissions (VEEs) are now considered as one of the most important sources of urban air pollution”

“screening, assessment, and prediction of ambient air pollutant due to VEE in such urban corridors has become an essential requirement as a part of an efficient local/episodic urban air quality management plan”

“environmental damage is caused both by extreme as well as by the average concentrations of pollutants. Hence, the models should predict not only ‘extreme’ ranges but also the ‘middle’ ranges of pollutant concentrations, i.e., the entire range.”

“Two types of forecast models have been developed. The first model uses a fuzzy expert system and forecasts the possibility of high O3 concentration. The second model uses a neural network system to forecast daily maximum concentration of O3 on the following day”

“The fuzzy models are capable of analyzing linguistic information and efficiently carry out programming/processing with improved knowledge representation and uncertainty reasoning. In addition, the neuro-fuzzy modeling technique can interpret and analyze any kind of information (numeric, linguistic, and logical) and possesses self-learning, self-organizing, and self-tuning capabilities, thus improving the quality of forecasts. The present study was under taken to develop models for CO based on neuro-fuzzy approach for different seasons”


Enhanced by Zemanta

Tuesday, November 9, 2010

Life-Cycle Assessment of Nanotechnology and Health


Jay Wright Forrester
Image via Wikipedia


Sustainable Nanotechnology: Through Green Methods and Life-Cycle Thinking (16 page pdf, Sustainability 2010, 2(10), 3323-3338, Oct. 25, 2010)

Before futurist Jay W. Forrester at MIT, developed the “World” model for the Club of Rome in 1970, he focussed on the same Systems Dynamic approach by applying it to an urban setting.  Many years later, we are still learning that a cradle-to-grave approach is needed to build pollution-free sustainable cities, especially with the advent of electronic devices such as TVs and cell phones, whose lifetimes are measured in weeks or months. The result of this and even greater miniaturization is an ever growing mountain of highly toxic materials which form part of either urban waste centres or shipments to even bigger mountains in China, India and other countries, as discussed in this post E-Waste

The article reviewed today assesses the life cycle of nanotechnology with some interesting observations such as the need to identify health impacts as soon as possible in development of these devices.


Key Quotes
“Sustainability and futures studies are linked to each other; the time scales involved may be different from the individual viewpoints of stakeholders, depending on whether they are futurists environmentalists. Futures thinking calls for planning in the time scale of hundreds of years whereas the environmental research community may think in terms of a few decades at the most”

“the need to conduct ―life cycle-based assessments as early in the new product development process as possible, for a better understanding of the potential environmental and human health consequences of nanomaterials over the entire life cycle of a nano-enabled product”

“The wide-ranging applications of nanotechnology have an equally widespread potential to adversely affect human health and the environment, through various exposure routes of nanoparticles, including occupational exposure”

“nano-based products that seem environmentally preferable over other alternatives in the Use stage may not actually turn out to be so when the whole life cycle is considered”

“the effects on human health and the environment are characterized based on environmental loadings… calculated using formulas based upon quantities of pollutants discharged to air, water, and land.”

“Risk Assessment goes from quantities of pollutants discharged to analyzing their effects under ambient conditions, through various exposure pathways”

“current Life-Cycle Assessment methodology, developed for use with conventional bulk materials, needs to be reconsidered and modified, if necessary, to make it suitable for evaluating nanomaterials”


Enhanced by Zemanta