Thursday, October 27, 2016

Are Cities Prepared for Climate Change Impacts?

Nederlands: Cartoon about climate change
Nederlands: Cartoon about climate change (Photo credit: Wikipedia)
Assessing climate change vulnerability in urban America: stakeholder-driven approaches (Abstract, Sabrina McCormick, Climatic Change, Aug. 31, 2016)

Also discussed here: Study assesses climate change vulnerability in urban America: Most city planners have yet to prepare for climate-related risks and the consequences. (ScienceDaily, Aug. 31, 2016)

And here: Politicization of climate change hinders adaptation in cities -- report (Brittany Patterson, E&E reporter, ClimateWire, Nov. 18, 2015

Today we review an assessment of how well 6 cities in the USA (Portland; Boston; Los Angeles; Tucson, Ariz.; Raleigh, N.C.; and Tampa, Fla.)are addressing their vulnerability to climate change. The order of preparedness is the in the same order as given with Portland at the forefront and Tampa bringing up the rear. The biggest obstacle was the lack of acknowledgment of climate change as an issue- something seen as well in Canada, in such cities as its capital city, Ottawa. The overlooked vulnerabilities includes hardening infrastructure against the increased frequency and intensity of such hazards as flooding and electrical storms and safeguarding some parts of the population, particularly older people, to such health hazards as smog events and heat waves.
  
Key Quotes:

“Findings demonstrate that conceptualizations of vulnerability are affected by intellectual frameworks that tend to orient around infrastructure and human health; that retrospective and prospective thinking are inter-related and affect one another; and that institutionalized forms and biases are critical. These factors shape the way that vulnerability is conceived differently than traditional expert frameworks.”

“Flooding due to rising ocean levels. Debilitating heat waves that last longer and occur more frequently. Rising rates of diseases caused by ticks, fleas, and mosquitoes, such as Lyme disease, Chikungunya, and Zika. Increasing numbers of Emergency Room visits for asthma attacks due to higher levels of ground-level ozone.”

 “city planners have yet to fully assess their vulnerability to climate change, leaving serious risks unaddressed. In their evaluations to-date, they see infrastructure and risks to specific human populations as the primary areas of concern.”

“The local experts she interviewed in Boston, Los Angeles, Portland, Raleigh, Tampa and Tucson tended to focus their thinking on climate vulnerabilities in terms of infrastructure, human populations, and other local concerns. These categories do not always mesh well with the frameworks used by national experts” “At the bottom of the list fell Tampa. Despite having a high climate risk -- with thousands of people below sea level and the increased possibility of being hit by a hurricane -- the city of about 350,000 has very little in the way of adaptation plans.”

 "Interviewees in Tampa overwhelmingly claimed that, mainly due to lack of political buy-in regarding climate change, their city remains one of the most vulnerable and least prepared cities in the country,"

 “In 1993, Portland became the first city to put forth a plan to cut its carbon emissions. This year, the city and Multnomah County released their 2015 Climate Action Plan, which outlines actions to be taken over the next five years. These include things like boosting solar and other renewable energy, reducing the total energy use of all buildings built before 2010 by 25 percent, and achieving zero net emissions in all new buildings.”

“When we're telling ourselves, 'If we could just advance our technology around renewable energy or build a flood wall, that would solve our problems,' but in fact none of those things ever gets developed unless we have the political will to develop them and public pressure to push for them and institutions that can push for their development and expansion."

“the biggest obstacle to assessing vulnerability to climate change on the local level was the lack of acknowledgement by some institutions that climate change is a serious issue.”

Tuesday, October 25, 2016

Do Biofuels Produce Less Carbon Emissions than Petroleum Fuels?

Carbon balance effects of U.S. biofuel production and use (John M. DeCicco, Danielle Yuqiao Liu, Joonghyeok Heo, Rashmi Krishnan, Angelika Kurthen, Louise Wang, Climatic Change, Aug. 25, 2016)

Also discussed here: Biofuels increase, rather than decrease, heat-trapping carbon dioxide emissions (ScienceDaily, Aug.25, 2016)

And here: Controversial study claims biofuels aren’t carbon neutral, says it’s much worse than gasoline (ZNE Science, Aug. 26, 2016)

Today we review research into the belief assumed by government policy to justify agricultural subsidies that biofuels (mostly from corn and soy beans) which currently amounts to 14.6 B gallons/year (or 6% of emissions) offset carbon emissions using petroleum products. This belief is based on the supposition that emissions from biofuels balance carbon emissions by absorbing CO2 from the atmosphere during photosynthesis from the new crops. Results indicate that this additional carbon uptake is only 37% of the emissions from biofuels. The conclusion reached is that the rising use of biofuels (which has tripled over the last 10 years) has resulted in net increase rather than a net decrease in carbon emissions.

  biofuel_chart  

Key Quotes:

“Production and consumption of biofuels, meaning biomass-based liquids such as biodiesel and ethanol, has grown steadily in the United States, from 4.2 billion gallons … in 2005 to 14.6 billion gallons .. in 2013”

“In 2013, biofuels accounted for 5.8 % of motor fuel energy end-use and 5.6 % of tailpipe CO2 emissions, up from a 1.4 % share in 2005.”

 “While U.S. biofuel use rose … over this period, additional carbon uptake on cropland was enough to offset only 37 % of the biofuel-related biogenic CO2 emissions. This result falsifies the assumption of a full offset made by LCA and other GHG accounting methods that assume biofuel carbon neutrality

 “Once estimates from the literature for process emissions and displacement effects including land-use change are considered, the conclusion is that U.S. biofuel use to date is associated with a net increase rather than a net decrease in CO2 emissions.”

 “Carbon uptake is dominated by corn, which has the largest planted area and a higher yield than other crops. The carbon harvest from corn alone rose by 25 TgC/yr over the analysis period due to a 17 % increase in planted area and a 7 % increase in yield. The corn-soy rotation is the most extensive U.S. farming practice and soybeans are second to corn basis in planted area. However, soybean yields average less than one-third those of corn by volume and only about 25 % those of corn on a carbon basis.”

 “errors arise when bioenergy is treated as carbon neutral in national and subnational policies, which do not impose globally coherent accounting that tracks all carbon stock changes”

“the conclusion is that rising U.S. biofuel use has been associated with a net increase rather than a net decrease in CO2 emissions. This finding contrasts with those of LCA studies which indicate that even crop-based biofuels such as corn ethanol and soy biodiesel offer modest net GHG reductions.”

Thursday, October 20, 2016

How Does a Low Carbon Future for Canada compare with Europe, the USA and Australia?

What low carbon futures might look like... (Ralph Torrie, Aug. 27, 2016)

Also discussed here: Low Carbon Energy Futures: A Review of National Scenarios (55 page pdf, Ralph D. Torrie, Tyler Bryant, Dale Marshall, Mitchell Beer, Blake Anderson, Ryan Kadowaki, and Johanne Whitmore, Technical Report, Trottier Energy Futures Project, Jan. 2013)

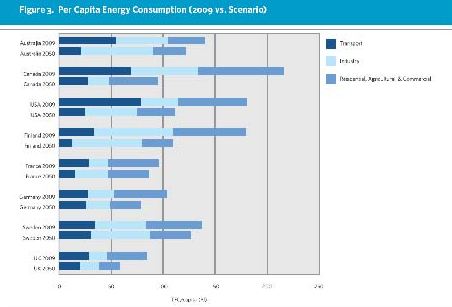
Today we review a report that compares low carbon future scenarios from 8 countries: 3 carbon resource rich (USA, Canada, Australia) and 5 European countries (Sweden Germany, France, Finland, UK). The common goal of the scenario was to lower carbon emissions by 80% from 1990 levels. Each country has its own approaches to the challenge from differing start points and so the scenarios differ as well although some similarities were noted including: decarbnization of the electricity supply, increased efficiency of fuels, a large supply of biofuels and electricity‘s share of the total energy consumption grows over time. Sweden has by far the lowest energy intensity because almost all of its electricity comes from nuclear, hydro and biomass- so that future reductions in carbon emissions comes from increased energy efficiency. Canada like Sweden also generates energy from non-carbon sources but has larger inputs ofnon-renewable energy sources (natural gas, coal, oil) in its energy pie and so has further to go to reach 80% less carbon emissions. Over 50% reductions in carbon emissions in Canada and the USA is in transportation where the growth of electric vehicles is key.

 energy-scenario  

Key Quotes:

“the TEFP objective is to chart a course for an 80 per cent reduction in Canada’s energy-related GHG emissions by 2050, using 1990 levels as a baseline.”

"present scenarios of how Canada could make the transition to a sustainable, low-carbon energy (emissions 80% below current levels) future through increased efficiency, greater reliance on renewable and low-carbon fuels and electricity, and changes in the way we use energy.”

“Eight recent low-carbon energy scenarios were selected for review by the Trottier Energy Futures Project to inform its effort to identify and analyze such scenarios for Canada. The criteria for inclusion in the review were that the scenario analyses be national in scope, comprehensive (covering all energy end uses), quantitative, long-term (to the year 2050), and focussed on deep reductions in greenhouse gas emissions (80 per cent below current levels).”

“the search for an 80 per cent emission reduction pathway (the magnitude of the response required to avoid what many scientists refer to as dangerous climate change) requires a deeper, broader strategy for transforming the energy system. When we add to that objective the caveat that emission reductions must also satisfy the imperatives of sustainability, the effort becomes even more challenging, and even more transformative.”

“Five pillars of low carbon future:
  • increased efficiency of fuel and electricity is paramount -- everything else depends on this,
  • electricity's share of energy end use increases (but not to 100%, not in this century),
  • the electricity supply is decarbonized,
  • a large and sustainable supply of biofuels is needed to hit the stretch targets in this century, and
  • we need to bend the baseline to achieve a lasting transition to a low carbon future.”
“Sweden has by far the lowest overall carbon intensity, at only 33 kg CO2e per GJ, reflecting the very high percentage of its electricity supply that comes from carbon-free sources—hydro, biomass, and nuclear power—as well as the high level of biomass use by industry, particularly pulp and paper.”

“Like Sweden, Canada generates a large share of its electricity supply from carbon-free sources, but Canada’s overall carbon intensity is still twice that of Sweden, reflecting much lower contributions from renewable sources and nuclear in the primary energy mix, as well as continued reliance on coal in some parts of the country.”

 “In the context of what an 80 per cent reduction in emissions might look like, it is interesting to note that the emissions intensities of the European nations, whether measured on a per capita or per GDP basis, are already 40 to 75 per cent below Canada’s. And yet, as discussed below, the scenario analyses for those same European countries reveal the possibility of reducing those emissions by 80 per cent or more, implying emission intensities by 2050 that are 90 to 95 per cent below current Canadian levels.”

“Much higher levels of energy efficiency, greater electrification of end uses, decarbonization of the electricity supply, and increased use of biomass are key drivers in all the low-carbon scenarios.”

“In the Canadian scenario included in our inter-country comparison, final energy demand is 55 per cent below the reference or “business as usual” case, due to energy efficiency improvements across all end uses and sectors. Final demand for heat drops by 40 per cent relative to the business-as-usual outlook, and specific energy use of industry drops by 70 per cent. Transport energy intensity drops by 55 per cent, and the share of electricity in meeting the final demand for transport grows from almost zero today to about 50 per cent by 2050.”

“The Australian scenario is drawn from the oldest of the studies we reviewed, completed in 2002. Efficiency improvements reduce final demand for energy in the industrial sector by 45 per cent, and in the commercial buildings sector by 55 per cent (building design and envelope improvements; more efficient lighting, and heating, ventilating, and air conditioning systems and equipment).”

“The United States scenario uses the U.S. EIA 2010 annual energy outlook, which already contains significant energy efficiency gains in its baseline. Counting both the gains in the EIA Annual Outlook and the additional assumptions in the U.S. low-carbon scenario, automobile efficiency increases by more than 50 per cent.”

Tuesday, October 18, 2016

What is Needed to Limit Global Climate Warming to 1.5C Using a Scenario Approach?

A Better Life with a Healthy Planet - Pathways to Net-Zero Emissions, A New Lens Scenarios Supplement (96 page pdf, Shell, May 2016)

Today we review a supplement to the Shell scenarios published in 2013 that examined steps toward a net zero energy future. The Shell scenario team became famous for their contributions to determining post-apartheid options for South Africa after 1990. It is a scoping document, starting with an estimate of the energy needs of the world in 2100 “for a better life”, based on a 50% population increase and a lowering of energy demand per person from as much as 300 gigajoules in USA/Canada to 100 GJ per person, as a world average – which amounts to a doubling of the global energy needs.

To accomplish this by 2050 and meet the Paris goal of limiting warming to 1.5 C, would require net zero emissions by that year and that, in turn, would require some form of negative carbon reduction, using technologies such as Carbon Capture and Storage (CCS) which would mean lowering its current high cost to around $30 per tonne by 2030- equivalent to wind power costs. Carbon pricing is seen as an absolute necessity to bring solar energy up to 40% of energy needs by 2060. It also requires 80% of passenger cars converted to electricity by 2030 and, in terms of land use, reducing drastically the amount of agricultural land used for feeding animals from the current 80%. For developing countries, investment in infrastructure and adapting to a solar society would allow them to leap-frog to net zero emissions as well.

 energy-future  

Key Quotes:

 “While we seek to enhance our operations’ average energy intensity through both the development of new projects and divestments, we have no immediate plans to move to a net-zero emissions portfolio over our investment horizon of 10–20 years

“We begin with “where we are now”, ..We then summarise what we mean by “a better life with a healthy planet” and how the energy system may evolve in future to deliver those objectives: the necessary transformations in both the consumption and production side of the energy system; economic growth pathways in developing countries; and the policies needed to support those transformations.”

 “Energy: enabling the material basis for “a better life”… how much energy is needed for a better life?..if we assume a future population of around 10 billion people by the end of the century, and multiply it by a hundred gigajoules per capita, we see that the global energy need would be about 1,000 exajoules (one exajoule is equal to one billion gigajoules) a year – which is roughly twice the size of the current energy system”

“Four essential policy levers..:
  • Long-term policy frameworks that support and incentivise the building of necessary infrastructure to enable the take-up of new low-carbon materials and technologies…
  • Economy-wide carbon pricing – whether through carbon trading, carbon taxes or mandated carbon-emissions standards…
  • Policies that mitigate the negative effects of the transition on the most vulnerable sectors of the economy and segments of society…
  • Other financial support and incentives for low-carbon research and development, particularly for early-stage development and deployment of promising technologies across all key sectors. “
“Consumers will need to choose lighter cars with more efficient drives. They will need to employ heat pumps, LED lighting and other energy-efficient appliances as well as increase recycling…by choosing to live in compact cities, consumers lower demand for energy because they don’t need to travel as far.” “Many models could not limit likely warming to below 2°C if bioenergy, CCS and their combination (BECCS) are limited (high confidence).

 “to limit the temperature rise to 3°C would require achieving net-zero emissions during the first half of the next century; 2.5°C would require net-zero emissions by 2100; 2°C would require net-zero emissions by around 2070; and 1.5°C would require net-zero emissions around 2050, followed thereafter by net-negative emissions.”

“In developed economies, the emerging standard for new buildings is “all-electric”. The combination of heavy insulation, triple glazing, electric boilers, heat pumps (effectively air conditioners working in reverse to heat a space) and rooftop solar PV power means that house builders can already build commercially viable, low-rise “net-zero energy” homes “

“Passenger road transport will be the easiest to electrify, with battery and fuel cell electric vehicles potentially reaching 80% of the global passenger car fleet over coming decades. EVs are particularly suited for short- and medium-distance travel in urban environments and densely populated regions,”

“the highest priority is to stop and reverse conversion of natural forests, peat-lands and high-carbon grassland to agricultural use.. the world must reduce emissions from rearing animals. 80% of agricultural land is used as pasture to feed animals.”

“to become the largest single primary energy source in the energy system by 2060, accounting for 40% of total primary energy…would require higher fossil-energy prices relative to solar, significant innovation in technology.., worldwide markets of solar products that appeal to the rich as well as the poor, a high electrification of stationary energy uses and a commitment by many people worldwide to sustainable sources of energy.”

 “By adopting new technologies and production processes, shifting to new energy sources and investing in the necessary enabling infrastructure, lower income countries could “leapfrog” to a net-zero emissions economy.”

 “keeping to a 2°C pathway would cost global society approximately 140% more without CCS. CCS is a capital-intensive technology….Commercial viability for a CCS plant would currently require a mechanism (for example, a carbon price) to reward capture and storage of CO2 at over $100 per tonne, but this cost could decline to around $70 per tonne in the early 2030s as more CCS plants are built and the supply chains they rely upon mature. This would put the price of CCS-based power generation from natural gas on a par with offshore wind.”

Thursday, October 13, 2016

How Polluted is Rome's Air?

Assessment of the Air Pollution Level in the City of Rome (Italy) (15 page pdf, Gabriele Battista, Tiziano Pagliaroli, Luca Mauri, Carmine Basilicata and Roberto De Lieto Vollaro, Sustainability, Aug. 23, 2016)

Today we review an assessment of urban pollution in Italy’s largest city, Rome, whose population in the metropolitan area reaches 4.3 million. Emissions from private vehicles, used by 60% of the population, are the main source of pollution, particularly in winter, with peaks twice daily at rush hour, like many other large cities in the developed world. PM2.5 is one of a small number of pollutants with major health impacts as well as damage to monuments and historical buildings n the urban area which are many in this city with a long history. Reduction or elimination of the post polluting vehicles (Euro class 0,1 and 2) is seen as the most effective way to reduce pollution levels.

 rome-obs-stns  

Key Quotes:  

Rome is the capital of Italy, and the largest city situated in the west-central part of the country. It is also one of the most populous cities in the European Union with 2.9 million residents in 1285 km2. Considering the metropolitan area of Rome, the population reaches up to 4.3 million residents in 5352 km2.”  

Pedestrian and public transport are only 20% of the total mobility, while 60% of journeys are made by private means of transport;”

“With reference to NO2, SO2 and (PMs) there is general agreement in the scientific literature that they are the main agents responsible for the damage encountered on monuments and historical buildings in urban areas”

“The people exposed to air pollutants are even more evident considering the weak ventilation, because of the presence of high buildings with a consequent reduction of the dispersion of air masses. For this reason, the contaminants formed below the building height remain at the pedestrian level and increase the health damages especially during thermal inversion episodes.”

“the major pollutant concentrations are observed in the winter seasons during the intense traffic flow and the threshold values are often exceeded.”

 “From the analysis of the current air situation, it is clear that traffic is the reason why the pollutant concentrations are so high. Traffic is the main source of [CO], [C6H6] and [PM10] concentrations….One of the main actions that can be performed is the reduction or elimination of the use of the most polluting cars, i.e., cars Euro 0, 1 and 2.”

Tuesday, October 11, 2016

What is the Future for the Summer Olympics with Global Warming?

The last Summer Olympics? Climate change, health, and work outdoors (Kirk. R. Smith, The Lancet, Aug. 13, 2016)

Also discussed here: When Will It Get Too Hot to Hold the Summer Olympics? (Linda Poon, MSN, Aug. 15, 2016)

And here: By 2085, most cities could be too hot for the Summer Olympics (Chris Mooney, Washington Post, Aug. 16, 2016)

And here: Are the Winter Olympics at Risk because of Global Climate Warming? (Pollution Free Cities, Mar.5, 2014)

Today we review a new report about the feasibility of holding the summer Olympic games when the temperatures and humidity get to levels unsafe for vigorous activities. Just as lack of cold and snow will make the choice of sites for Winter Olympics difficult, so it is with high levels of heat and moisture in the air with the Summer Olympics The authors predict that with the course climate warming is on now that, in 50-60 years (2085), there will only be 8 cities out of 543 cities outside western Europe that would be “low risk” or acceptable. This same threat applies more generally to anyone attempting to work or exercise physically outdoors during the summer heat.


olympics  

Key Quotes:

"You could take a risk, and plan your Olympics, and maybe not get the hot days you expect, but that would be a big risk when there are many billions of dollars at stake,”

“The core issue is that if there’s too much humidity, it [wet-bulb temperature] limits our ability to use evaporation, through sweating, to cool down our bodies…it’s come to be understood as the best indicator of heat stress on the body…At 98 degrees and 100 percent humidity, you can walk slowly outdoors, but if you try to run, you can actually die. It’s a matter of just the basic physics of it,”

 “with even a 10 percent chance of these extreme conditions, the Olympics couldn’t be held..” “if you assume that a 26 degree Celsius .. wet bulb globe temperature (in the shade) is the limit, then “only eight (1·5%) of 543 cities outside of western Europe would meet the low-risk category for the Games in the year 2085. If you go farther and push the danger zone up to 28 degrees C (82.4 F), then 33 more cities would be viable.”

“Projections out to the early 22nd century, which carry even more uncertainty, suggest the last cities in the northern hemisphere with low-risk summer conditions for the Games will be Belfast, Dublin, Edinburgh, and Glasgow,”

“the larger point is not about the Olympics, but rather, about people who work outdoors and who are massively more numerous than elite athletes. These are the individuals who will really suffer the most from an increasing risk of heat stress going forward.”

Thursday, October 6, 2016

How well did London’s Congestion Charge Perform?

London Congestion Pricing – Implications for Other Cities (5 page pdf, Todd Litman, CESifo DICE Report 3/2005, Mar. 2005)

Today we review a paper that assessed the performance of the London Congestion Charge after it had operated for 2 years. The winners include bus and taxi users, pedestrians and cyclists and motorists with high value trips and most city centre businesses with congestion delays reduced reduced by 50% and net annual revenue of 97 million UK pounds to support transit/pedestrian and cycling infrastructure. Losers include motorists with marginal value trips and riders and motorists in border areas who a 10% increase in spillover traffic (but no more delay because of proactive action to adjust traffic signals). The London congestion charging system was a first for Europe and probably stimulated similar initiatives in Stockholm, Sweden Trondheim, Norway and Singapore in Asia.

 london-cong-ch  

Key Quotes:

“A basic economic principle is that consumers should pay directly for the costs they impose as an incentive to use resources efficiently. Urban traffic congestion is often cited as an example: if road space is unpriced traffic volumes will increase until congestion limits further growth”

“Since 17 February 2003 motorists driving in central London ..on weekdays between 7:00a.m.and 6:30 p.m.are required to pay £5,increasingto £8 in July 2005.”

 “Approximately 110,000 motorists a day pay the charge (98,000 individual drivers and 12,000 fleet vehicles),increasingly by mobile phone text message.”

“The2004/05 budget year is projected to earn £190 (instead of £160) million in total revenues (£118 million in fees and £72 million in fines), with £92 million in overhead expenses, resulting in £97 million in net revenues.”

“Prior to the congestion pricing program about12 percent of peak-period trips were by private automobile. During the programs first few months automobile traffic declined about 20 percent (a reduction of about 20,000 vehicles per day), resulting in a 10 percent automobile mode share”

"Peak period congestion delays declined about 30 percent, and bus congestion delays declined 50 percent. Bus ridership increased 14 per-cent and subway ridership about 1 percent.”

“Although there is 10 percent more traffic on the peripheral roads, journey times on them have not increased, in part because traffic signal systems on these roads were adjusted in anticipation of these traffic shifts"

 “This pricing program indicates that private automobile travel is more price sensitive than most experts believed. This is good news for congestion reduction but bad news for revenue generation.”

Tuesday, October 4, 2016

How Does Geoengineering fit with the Paris Agreement on Climate Change?

Schematic showing both terrestrial and geologi...
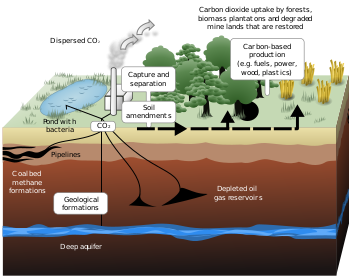
Schematic showing both terrestrial and geological sequestration of carbon dioxide emissions from a coal-fired plant. Rendering by LeJean Hardin and Jamie Payne. Source: http://www.ornl.gov/info/ornlreview/v33_2_00/research.htm (Photo credit: Wikipedia)
Implications of the Paris Agreement for Carbon Dioxide Removal and Solar Geoengineering (10 page pdf, Joshua B. Horton, David W. Keith, and Matthias Honegger, Harvard Project on Climate Agreements, Jul. 2016)

The Paris Agreement did not explicitly mention geoengineering as a solution, in addition to efforts to reduce carbon emissions, to the challenges involved in reaching the ultimate goal of end to global warming and a stable radiation equilibrium,. Geoengineering may be broken down into two approaches: carbon dioxide removal (CDR) (as shown, for example, by carbon capture and sequestration) and solar radiation management (SRM) (as shown, for example, by the introduction of aerosols into the atmosphere to reflect incoming solar radiation). The authors of the paper reviewed here flag several indirect references to CDR in the Paris agreement as well as suggesting the inevitability of SRM, if there is any chance of meeting the very challenging objective of limiting warming to 1.5 C or less. They noted that CDR comes with a high short term cost while SRM does not but could limit warming to 1.5 C- although SRM comes with much more uncertainty when it comes to side effects and governance issues.

Key Quotes:

“We survey the implications of the revamped climate policy regime for carbon removal and solar geoengineering, hereafter referred to using the common acronyms carbon dioxide removal (CDR) and solar radiation management (SRM).”

“The scope of “mitigation” activities under the Agreement explicitly includes removal of carbon dioxide: Article 4 calls for achieving “a balance between anthropogenic emissions by sources and removals by sinks of greenhouse gases in the second half of this century.”  

“Although it does not call for CDR[carbon dioxide removal] per se, core elements of the Agreement…are based on the assumption that CDR will be widely used to help reduce atmospheric concentrations of CO2 over the coming century.”

 “some forms of SRM[solar radiation management], such as the injection of reflective aerosols in the stratosphere, would reduce global radiative forcing and surface temperatures….this reduction in radiative forcing carries with it new risks and uncertainties, and there is no sense in which increasing the Earth’s reflectivity is the equivalent of reducing carbon dioxide concentrations.“

 “analysis using state-of-the-art climate models has shown that under moderate amounts of SRM…almost all regions of the world would experience climates closer to preindustrial conditions with SRM compared to what they would experience without it”

"the fact that the Agreement contains explicit quantitative temperature goals instead of, say, an explicit carbon budget goal (due largely to continuing objections from oil-exporting states) actually facilitates the eventual inclusion of SRM in the post-Paris system”

“the economics of CDR are, in fact, very similar to those of emissions mitigation: both entail high, local, short-term costs that discourage widespread deployment.”

“These obstacles, however, do not apply to SRM, which models demonstrate would be capable of limiting global warming to 1.5 °C above preindustrial levels (if this were desired in the future), albeit with known and likely unknown side effects and serious governance challenges. “