Tuesday, September 23, 2014

Sharpening the Spatial Resolution of Exposure to Particulate Matter

Spatio-temporal modeling of particulate air pollution in the conterminous United States using geographic and meteorological predictors (34 page pdf, Jeff D Yanosky, Christopher J Paciorek, Francine Laden, Jaime E Hart, Robin C Puett, Duanping Liao and Helen H Suh, Environmental Health, Aug. 5, 2014)

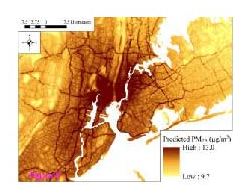
Today we review a paper describing how a statistical model can be used to provide the necessary spatial detail on the exposure to particulate matter. Knowing this is especially important near major roads in urban areas where there is a high volume of diesel powered vehicles which emit PM2.5 and where the distance from the emission sources to where people live or work is critical. The authors show examples of the mapping for cities such as New York as well as across the USA.

 high resolution PM in NYC 

Key Quotes:

 “epidemiologic studies of the chronic health effects of PM air pollution have used crude methods to assess particulate exposures, estimating subject’s chronic exposure either by imputing ambient concentrations from the nearest monitor or by using area-wide averages [2], thus ignoring within-city spatial gradients in air pollutant levels and restricting these studies to areas with nearby monitoring data. “

 “Our models provide estimates of monthly-average outdoor concentrations of PM2.5, PM10, and PM2.5–10 with high spatial resolution and low bias. For PM2.5 and PM10, the models performed well in urban and rural areas and across seasons”

Thursday, September 18, 2014

What is E-Waste and What Health Risks does it Bring?

E-Waste: Health Impacts in Developing Countries (EHS Journal, Jul. 19, 2014)

Today we review a paper that describes the size and health threat of the annual disposal of 40M tones of e-waste, nearly 50% of which comes from EU and USA/Canada, with most of the disposal and processing taking place in Asian countries such as India, China and Pakistan. E-waste is considered more dangerous than most other municipal waste because of the harmful metals that when incinerated produce high health risk dioxins and furans. Government and public health regulations are called for in the manufacturing and recycling of electronic devices, as well as in the safe handling of the waste management.

 ewaste 

Key Quotes:

“E-Waste is the term used to describe old or discarded electronics and appliances, for example, cathode ray tube (CRT) tele­visions and computer monitors, desktop computers, laptop computers, liquid crystal display (LCD) monitors, cell phones, keyboards, computer mice, print­ers, and copiers”

“the burning of E-Waste to recover precious metals releases organic compounds and, potentially, dioxins and furans. Arsenic and asbestos may act as catalysts during burning, increasing the formation of dioxins, which are carcinogenic in nature.”

 “Approximately 40 million metric tons of E-Waste are produced globally every year, with developed economies such as the European Union and the United States accounting for 22.5% and 24%, respectively (UNEP 2009). Nearly 13% of the world’s E-Waste is managed and recycled by developing countries”

“Informal recycling markets established in China, India, Pakistan, Vietnam, and the Philippines handle from 50% to 80% of the E-Waste managed by the developing countries”

 “E-Waste is more hazardous than many other municipal wastes because electronic gadgets can contain thousands of components made of potentially harmful chemicals such as lead, cadmium, chromium, mercury, beryllium, antimony, polyvinyl chlorides (PVC), brominated flame retardants, and phthalates. Long term exposure to these compounds affects the nervous system, kidneys, bones, and reproductive and endocrine systems.”

 “Both developed and developing countries share joint responsibility in regu­lating electronic device manufacturing and E-Waste trans-boundary movement. In countries where primitive recycling processes exist, human health — especially children’s health — should drive regulation and management of recycling activities.”

Tuesday, September 16, 2014

Does Pollution from afar have a greater Health Impact than locally produced Traffic-Related Pollution?

English: Smokestacks from a wartime production...
The effect of secondary inorganic aerosols, soot and the geographical origin of air mass on acute myocardial infarction hospitalisations in Gothenburg, Sweden during 1985-2010: a case-crossover study (29 page pdf, Janine Wichmann, Karin Sjöberg, Lin Tang, Marie Haeger-Eugensson, Annika Rosengren, Eva M Andersson, Lars Barregard and Gerd Sallsten, Environmental Health, Jul. 29, 2014) 


Key Quotes: 

 “Acute myocardial infarction (AMI) is the most important manifestation of ischemic heart disease. The major risk factors for CVD [cardio-vascular disease] are age, sex, smoking, low physical activity, increased waist circumference, diabetes and hypertension …Evidence is increasing on the effects of nontraditional risk factors, such as air pollution and weather (e.g. temperature) on CVD mortality and morbidity, specifically as short-term risk factors” 

“The REVIHAAP report concluded that there is currently no threshold level (i.e. no safe level) for PM10, PM2.5, nitrogen dioxide (NO2) and ground-level ozone (O3) and that the concentration-response functions are mostly linear” 

“Locally generated PM (PMrest) is associated with an increase in AMI hospitalisations during 1990–2000 in the cold period, whilst days with limited local dispersion within Gothenburg were important during 2001–2010, also in the cold period. Altogether this indicates the significance of local emissions from e.g. traffic within Gothenburg.”

Thursday, September 11, 2014

What Determines Maximum Car Use Levels in Different Countries?

The Future of Driving In Developing Countries (138 page pdf, Liisa Ecola, Charlene Rohr, Johanna Zmud, Tobias Kuhnimhof, Peter Phleps, RAND Corporation's Institute for Mobility Research, Jul. 2014)

Also discussed here: New Study Predicts Vehicle Travel Saturation Levels (Planetizen, Jul. 27, 2014)

Today we review a RAND report that examines and predicts car use in developed (Germany, Australia, Japan) and developing countries (Brazil, Russia, India and China), using eight factors that contribute to car use (demographics, income, geography, fuel price, alternatives, vehicle infrastructure and degree of car culture). Results indicate the most significant predictors of car use are car infrastructure and spatial dispersion leading to sprawl, not as one might expect, fuel price, availability of public transit or income, noting that Japan with the same income has ¼ the car use of the USA. The question is whether large industrial countries just beginning to embrace car use, such as China, will follow the USA or Japan (the authors predict the latter). Interestingly, in response to climate change concerns, the authors note that public policies aimed at reducing carbon fuel use and new technologies may well alter predictions made with the assumptions made with this model.
  car saturation 

Key Quotes:

“The report …identifies various factors that affect motor vehicle ownership and use, including demographics (the portion of residents who work), incomes (which is the primary factor considered in previous studies), geography (density and travel distances), vehicle infrastructure (road and parking facility quality and price), fuel price, vehicle ownership policies (such as vehicle taxes and registration fees), quality of alternatives to driving, domestic oil and vehicle production industries political influence, and the favorability of car culture (whether popular culture and consumer attitudes favor automobile travel over other modes)”

 “although motor vehicle ownership and use tend to increase as incomes increase from very low to moderate, at high incomes they tend to saturate, and the level of saturation depends significantly on public policies… at the same average level of income, people in Japan travel about one-third the number of kilometers (per capita) that people in the United States do.. 4,000 annual kilometers in Japan, 7,000 annual kilometers in Germany, 10,000 annual kilometers in Australia, and 15,000 kilometers in the United States.”

“one country might move quickly into personal vehicle ownership and thus higher rates of driving when rising income levels make vehicles affordable to a large number of households. Another country might experience more gradual growth in travel by personal vehicle over many decades. A third country might be slower to adopt personal vehicle ownership because existing travel modes already meet mobility needs or because policies limit vehicle purchases or vehicular travel.”

“Lack of Alternatives to Driving.. Australia’s largest cities are served by rail systems, including the world’s largest streetcar network, in Melbourne…Fifteen percent of Australians report having no access to transit, while 33 percent have “easily available” access. Germany has a large supply of public transport infrastructure, including rail lines dating back to the early 1900s.. In the late 1960s, the West German government instituted a fuel tax, in part to fund larger public transport projects…alternatives to driving in the United States varies not only by city but also within urbanized areas. Essentially all cities, even small ones, operate bus systems, but many of these systems provide very limited services and function as social services provided to elderly, disabled, or low-income patrons. Most large and medium-sized cities have rail systems but, in large portions of those urbanized areas, service is infrequent or nonexistent.”

“The presence of oil is considered an indirect factor, in that the government of a country with plentiful oil may encourage consumption to help a major industry (as in the United States). It may also encourage a country with little or no domestic production to promote energy-efficient transportation modes (as in Germany or Japan).”

“Among the nine factors identified as influencing mobility in developed countries, two factors—car infrastructure and spatial dispersion—were identified as most significant. Lower average urban densities stimulate greater auto use, a relationship we see clearly in the much higher motorization rates of Australia and the United States during their motorization periods.”

“the need to control GHG emissions or seismic changes in travel patterns as a result of new technologies, may become more important than the factors we have considered here”

Tuesday, September 9, 2014

Are HOT Lanes Coming to Ontario’s Highways and How do they Work?

HOT Lanes: A Better Way to Attack Urban Highway Congestion - High-occupancy toll lanes benefit all highway users—not just the affluent (6 page pdf, Robert W. Poole Jr. and C. Kenneth Orski, Regulation, 2000)

Also discussed here: HOT Lanes: A Better Way to Attack Urban Highway Congestion (Robert W. Poole Jr. and C. Kenneth Orsk, CATO Institute)

 And here: 2014 Ontario Budget Passes in Legislature - Plan Will Create Jobs, Build Modern Infrastructure and Transportation, Enhance Retirement Security (Press Release, Ontario Ministry of Finance, Jul. 24, 2014)

And here: Budget 2014 Building Modern Infrastructure (9 page pdf, Ontario Ministry of Finance, May 1, 2014)

And here: 495 Express Lanes Usage Update - July 2014 And here: Metrolinx: HOT lanes should be used to break the ice for VMT charging (Grush Hour, Apr. 18, 2013)

Today, we review a paper that was written 14 years ago but is still highly relevant in today’s world of congested urban highways that are getting worse, in the US and Canada at least. The authors review the state of car-pool or transit-only lanes (or high occupancy lanes as the transportation planners dub them), conclude that these lanes tend to be underused and are ineffective and point out the advantages of converting that the HOV lane to a HOT lane which introduces supply and demand pricing to the argument. Given also the great pressure for politicians against introducing any tolls but the equally great pressure to generate revenue and lower taxes, HOT lanes seem inevitable.

One must think that the government in Ontario is thinking along the same lines as they propose HOT lanes for all 400-series highways in the province, included in the May 1, 2014 budget and repeated in a budget bill that received Royal Assent on Jul. 24, 2014 as part of the “economic tools” to pay for over $30B needed for public transit over the next 20 years. A first step to more comprehensive road and congestion pricing perhaps?

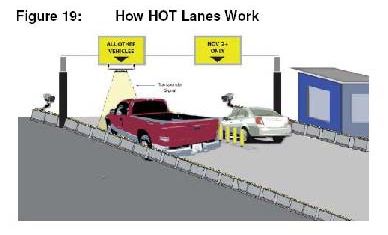
 how HOT lanes work  

Key Quotes:

“High-Occupancy Vehicle (HOV) lanes were once seen as innovative and beneficial, the idea being that they would encourage carpooling and thereby reduce highway congestion and air pollution. But opposition to HOVs is spreading “

“Irate drivers see hov lanes as an inefficient use of scarce road space. They claim that few drivers take advantage of carpool lanes, while thousands of solo commuters must endure stop-and-go traffic in adjacent general-purpose lanes.”

“Because a freeway lane has a smooth-running capacity of 1,500-1,800 vehicles an hour, an hov lane must carry at least 700-800 vehicles an hour in order to offer equivalent “person throughput,” at an average of 2.1-2.2 persons per vehicle.”  

“we are not tolling HOV lanes. There is an expansion of HOV lanes. The system of HOT lanes does not diminish by one car the access to the entire system, including the HOT lanes, for people who have more than one vehicle….Metrolinx has carefully planned out which routes are optimal. Metrolinx can actually tell you that the price per kilometre is 47 cents. .. very successful HOT lanes across North America are used mostly by people with under $60,000 income, that it’s been a benefit to middle-income families, especially moms who are trying to get their kids to school. It’s a very cost-effective option, and it’s had a significant impact on reducing congestion. This is hardly something used by only affluent people, and it has not compromised the role of HOV lanes one iota” (Hon. Glen R. Murray, Ontario Minister of Transportation and Infrastructure, Legislative Debates, May 14, 2013)

“HOT lanes can be established rather inexpensively by placing electronic toll booths in existing HOV lanes, alongside the travel lanes or in the medians of highways.”“Data from existing HOT lanes projects indicate that people at all income levels use the lanes when saving time is important to them.”

“A hot lanes project may meet one of these four objectives:
  • Absorb unused capacity on an existing hov lane.
  • Absorb extra capacity arising from a switch from hov-2 to hov-3.
  • Relieve congestion on a highly congested freeway.
  • Manage traffic on a new limited-access highway."
“Electronic signs in front of the entrance to the hov lanes notify motorists of the current toll as they approach the toll lanes. A motorist who wants to use the hov lanes simply passes through a special lane where overhead antennas scan the windshield-mounted transponder and automatically deduct the posted toll from the motorist’s prepaid account.”

"The cost of converting an existing hov lane to a hot lane is relatively low. The main capital expenditures are for plastic pylons, changeable message signs, gantries, toll-reading and video-enforcement equipment, and computer hardware and software.”

“hot lanes yield other general benefits:
  • They reduce congestion in adjacent general-purpose lanes.
  • Transit vehicles gain access to faster-moving lanes, which entices some commuters to switch from autos to express buses or commuter-shuttle vans.
  • Further, toll revenues can be used to provide express bus service, as San Diego is doing in its I-15 hot lane corridor.
  • Emergency vehicles can reach their destinations much more quickly on hot lanes.
  • And, unlike general-purpose highways and hov lanes, only the users of a hot lane facility pay for it.”
“The Province is committing to convert select high-occupancy vehicle (HOV) lanes in the GTHA into high-occupancy toll (HOV/HOT) lanes, in which carpooling drivers would continue to drive for free, but other drivers would be able to choose to drive in these lanes for a toll. Toll-free options would exist on all highways that have HOV/HOT lanes. This model has been successfully implemented in several places, including in Florida, Texas and California. The Province will consult with its partners and bring forward a plan by year-end.”[2013 Ontario Budget]

“New Dedicated Funds for Investment in Transportation Infrastructure…Dedicating net revenue gains from high-occupancy toll lanes when they become available"[2014 Ontario Budget]
Thursday, September 4, 2014

Does “Free” Parking Downtown Make Any Sense?

How to Tax Parking (And How Not To) (Transport Providence, July 8, 2014)

Also discussed here: What’s the Best Way to Tax Parking? (Angie Schmitt, StreetsBlog, Jul. 25, 2014)

And here: Parking Taxes - Evaluating Options and Impacts (21 page pdf, Todd Litman, Victoria Transport Policy Institute, Aug. 29, 2013)

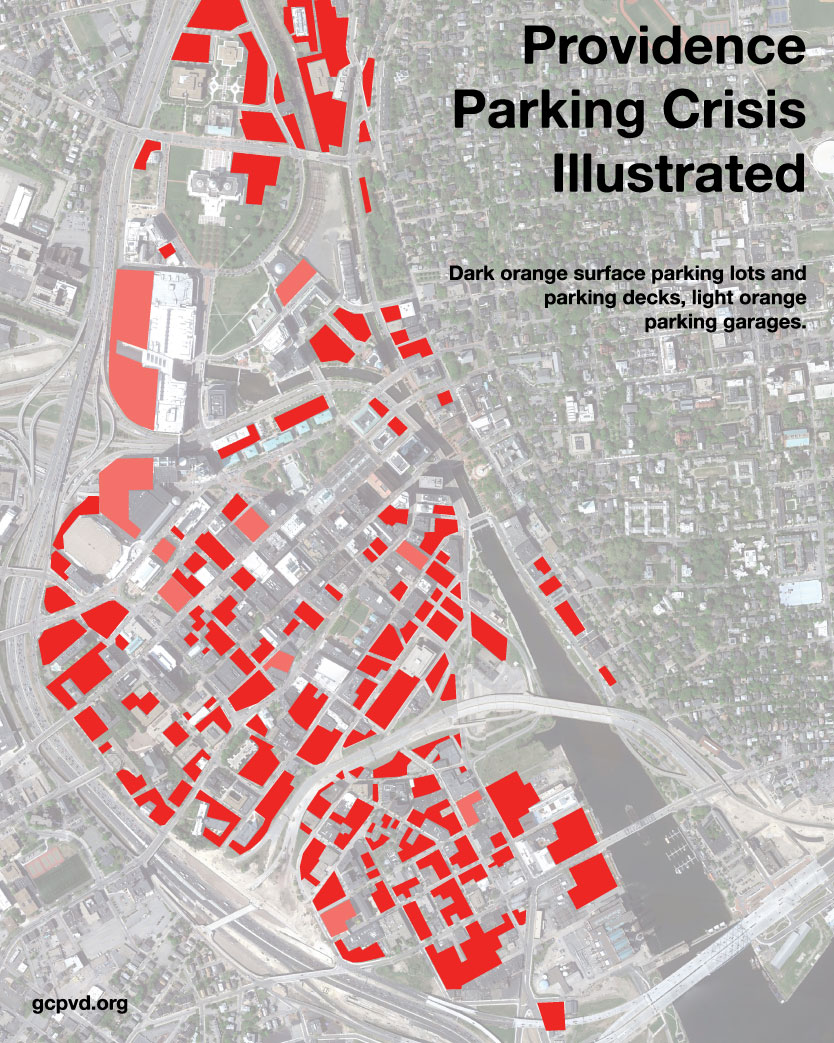
Today we review a blog post that discusses the equity or fairness in how parking spaces and lots are taxed, noting that many parking lots next to stores offer “free’ parking and these are taxed at a lower rate. A better approach from a fairness and environmentally wise point of view is to tax all spaces at the same rate. Parking rates are key to lowering congestion as well as discouraging casual use of roads by cars in the downtown- and as we see in San Francisco (SfPark), applying varying parking rates according to demand goes even farther.

 providence parking 

Key Quotes:

“it's politically easiest to tax parking on dedicated lots, rather than to do a "per space" tax on all parking, but this way of taxing parking has problems”

“the lot parking attached to businesses is free to customers and employees. Of course, it's not actually free. It costs money which is passed into lost wages or higher prices. But to the worker or consumer, it appears free.”

 “When the price of commercial parking, i.e., the lots downtown that charge per hour, becomes more expensive without putting an equal burden on these other parking lots, it gives a stronger incentive for businesses to include free parking into their design as a benefit to customers or workers. This is not what we want.”

“Providence's smallest (by area) businesses produce the most revenue for the city per acre, while those that appear to be the anchor businesses often produce much lower revenue per acre.”

“when we set a parking tax, it should be per parking spot. This is a fair tax, because businesses are free to choose whether the cost of parking is worth it to them in a market, or if they'd like to trade some of that cost away for greater infill development”

"A parking tax is fair in a market sense because it puts a value on things that are actually consumed by drivers…it allows funds that are currently being used to prop up car ownership to be repurposed--either through an expanded market for housing, lower prices on rents; or even in expanded services, such as better spending on schools. It makes sense in an environmental sense because it helps us to achieve green goals”

Tuesday, September 2, 2014

Changing Urban Form and Transport CO2 Emissions: An Empirical Analysis of Beijing, China (22 page pdf, Yunjing Wang, Yoshitsugu Hayashi, Jin Chen and Qiang Li, Sustainability, Jul. 22, 2014)

Today we review an assessment of commuting emissions for China’s capital city, Beijing, which has undergone large increase in population as well as in size of its suburban areas which has contributed to a four-fold increase in emissions. The journal article attributes the increase in emissions to commuting distance and the shift toward the use of cars which in turn is related to the distance between workplace and home which is a function of urban form. Solutions to achieve sustainable transportation include planned development of housing which would shorten the commuting as well as a greater priority for metro subways over roads for cars.

 commuting co2 china  

Key Quotes:

 “As the second-largest sector in terms of emissions, transport accounted for 22% of global CO2 emissions in 2010 [5], and its share in the overall energy consumption and emissions is continuously growing, which makes it one of the most important contributors to global CO2 emissions”

“the urban form is a critical determinant for limiting the environmental impact of transportation systems after several decades of studies in developed countries or cities…a strong negative correlation between transport energy consumption and population density.. In addition to density, other quantitative measurements of urban form and structure features, such as size, mixed land uses, compactness, open space, accessibility, and so on, were also used to gauge environmental implications in terms of CO2 emissions for different cities”

 “[but in some cases] the densification of urban populations worsen congestion, and does not necessarily contribute to energy conservation,and their work is only valid for certain conditions, i.e., within the central business district (CBD)” “From 2000 to 2009, the total population of Beijing increased by 29%, from 13.64 million to 17.55 million.”

“ Despite the different degree of decentralization of population and employment in Beijing, the urban form of Beijing is still highly centralized by physical form.”

“many employees, especially low income ones, who still work in the urban core, have to choose to live farther away from the traditional urban core in favor of more affordable housing”

 “On the whole, from 2000 to 2009, the changing urban form of Beijing had a larger impact on the use of cars (196.3%) and public buses (−63.8%), while the improvement of the transport network of Beijing had a larger impact on metro users (97.2%)”

“Aggregate commuting CO2 emissions was more than four-fold from 1.37 million tons in 2000, to 6.35 million tons in 2009, with a robust average annual growth rate of 19%...CO2 emissions from cars increased more than four times, and its share reached 85% in 2009,”

 “commuting distance is, to a very large extent, a determinant for the CO2 emissions of the commuting system…A jobs-housing balance policy has been considered as a strategically useful tool to alleviate congestion and automobile emissions.”