Showing posts with label Ottawa. Show all posts

Thursday, January 28, 2016

Where is the Worst Traffic Congestion in Canada?

How Bad is the Traffic Where You Live? (Zack Gallinger and Arik Motskin, The 10 and 3, Dec. 10, 2015)

Also discussed here: Which Canadian city has the worst traffic? (Alexandra Pope, Canadiana Geographic, Dec. 10, 2015)

And here: Vancouver has the worst traffic in Canada, new congestion study claims (Jake Edmiston, National Post, Mar. 31, 2015)

And here: TomTom Traffic Index - Measuring congestion worldwide (TomTom, 2016)

Today we review new data showing which city has the worst traffic. By one measure, TomTom’s 2014 traffic index show Vancouver with 35% as the worst, followed by Toronto (31%), Ottawa (28%) and Montreal during the day but this changes during the evening rush hour to Toronto and Vancouver tied at 66% followed by Ottawa at 63%. Another measure, the average stretch multiplier, the ratio between free flowing and congested traffic, shows Toronto as the clear winner/loser with 2.8 with Calgary and Ottawa gaining rapidly as equally sprawled and growing large cities.
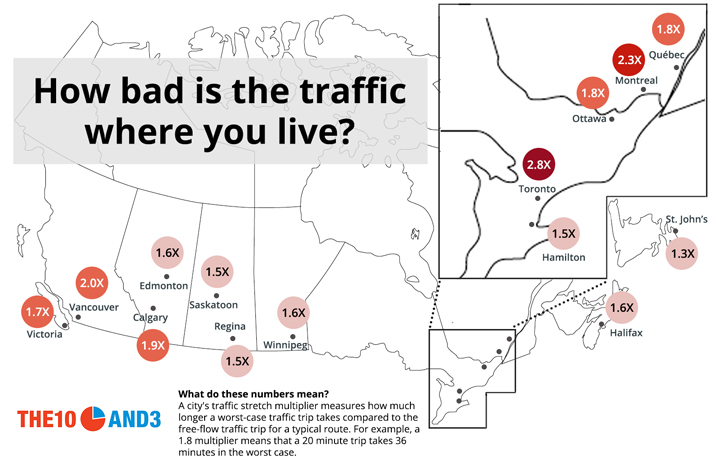
 canada_traffic_map  

Key Quotes:

“the Canadian gridlock problem cost the average commuter nearly 79 hours last year, up from 77 hours in 2013”

“Vancouver again ranked third in North America — just behind the notorious traffic of Los Angeles and Mexico City.Toronto was a close second to Vancouver in the Canadian rankings, with Ottawa and Montreal taking the third and fourth spots respectively. Edmonton and Quebec City tied for fifth and Calgary had the honour of finishing last”

“Zack Gallinger and Arik Motskin studied how long it would take to travel a variety of routes in major Canadian cities during free-flowing traffic and during a worst-case scenario* traffic jam. They called the ratio between these two trip times the “traffic stretch multiplier. Unsurprisingly, Toronto tops the list with an average traffic stretch multiplier of 2.8. The problem, the study’s authors say, is the city’s highways are ill-equipped to deal with the population density of the surrounding communities.”

“While a trip downtown from dense residential areas like Markham in the north or Scarborough in the northeast could take under a half hour in free-flow traffic, commuters in peak traffic can expect a voyage of well over 75 minutes,”

“growing cities like Calgary and Ottawa are beginning to feel traffic pressure: certain routes within those cities can produce traffic stretch multipliers of 2 or more during worst-case scenarios.”

Thursday, May 14, 2015

What are the Health Implications for Children in Schools Near Traffic?

Association between Traffic-Related Air Pollution in Schools and Cognitive Development in Primary School Children: A Prospective Cohort Study (24 age pdf, Jordi Sunyer, Mikel Esnaola, Mar Alvarez-Pedrerol, Joan Forns, Ioar Rivas, Mònica López-Vicente, Elisabet Suades-González, Maria Foraster, Raquel Garcia-Esteban, Xavier Basaga, Mar Viana, Marta Cirach, Teresa Moreno, Andrés Alastuey, Núria Sebastian-Galles, Mark Nieuwenhuijsen, Xavier Querol, PLoS Med, Mar. 3, 2015)

Also discussed here: Monitoring Roadside Air Pollution and Urban Health Impacts (Pollution Free Cities, Feb. 15, 2013)

 Today we review research into the impact on brain development of children at schools exposed to high and low pollution levels produced by traffic emissions in Barcelona, Spain. Results indicate that students in low pollution areas have almost twice the increase in working memory (11.5%) per year compared to children in high pollution areas (7.4%). This is a warning to urban planners concerning the locations of schools: locate them at least 500 m from heavy traffic or take responsibility for the health impacts to the young children who attend these schools. Unfortunately many cities have schools located on major roads with traffic (in Ottawa, for example, more than 50% of day-cares (and 20% of schools) are located within 50 m of heavy traffic).

 air pollution schools  

Key Quotes:

“Air pollution is a suspected developmental neurotoxicant. Many schools are located in close proximity to busy roads, and traffic air pollution peaks when children are at school. We aimed to assess whether exposure of children in primary school to traffic-related air pollutants is associated with impaired cognitive development.”

“Human brain development is a complex and lengthy process. During pregnancy, the basic structures of the brain are formed, and the neural circuits that will eventually control movement, speech, memory, and other cognitive (thinking) functions, as well as the function of many organs, begin to be established…Much of the development of the cerebral cortex happens during the first two years of life. For example, babies usually learn to crawl at about nine months. Other aspects of brain function take longer to develop. Thus, the cognitive functions that are essential for learning undergo considerable development between the ages of 6 and 10 years, and further brain changes occur during adolescence.

“there was an 11.5% 12-month increase in working memory at the lowly polluted schools but only a 7.4% 12-month increase in working memory at the highly polluted schools. Other analyses indicated that children attending schools with higher levels of traffic-related air pollutants in either the courtyard or in the classroom experienced a substantially smaller increase over the 12-month study in all three cognitive measurements than those attending schools with lower levels of pollutants.”

“ the developing brain may be vulnerable to traffic-related air pollution well into middle childhood, a conclusion that has implications for the design of air pollution regulations and for the location of new schools.

Monday, July 7, 2014

How Congested with Traffic are Canadian Cities?

TomTom Americas Traffic Index (74 page pdf, TomTom, Jun. 3, 2014)

Also discussed here: TomTom Live Traffic And here: Vancouver home to worst gridlock in Canada (CTV News, Jun. 3, 2014)

Today we review the latest report on Traffic Congestion by the GPS-maker, TomTom. The three worst cities in Canada are Vancouver, Toronto and Ottawa where the average driver with a 30 minute commute encounters as much as 87 hours of delay each year. TomTom also produces real-time, live traffic congestion maps, such as the one shown below for Ottawa during the morning rush hour. The reddened areas indicate where there is a need for congestion charging to lower and redistribute peak traffic flow away from these road segments.


congestion Ottawa 

Key Quotes:

“A new study is out suggesting Vancouver is the worst city in Canada for gridlock…. the average person experiences 87 hours of delay time a year, based on a 30 minute daily commute.. After Vancouver…the most congested cities in Canada are Toronto, then Ottawa, Montreal, Calgary, Quebec City and Edmonton.”

“Moscow tops the international list, followed by Istanbul, Rio de Janeiro, Mexico City, Sao Paulo, Palermo, Warsaw, Rome, Los Angeles and Dublin.”

“The methodology… measures travel times during the whole day and during peak periods and compares these with measured travel times during non-congested periods(free flow). The difference is expressed as a total average percentage increase in travel time…As well as assigning and ranking the overall congestion level of over 180 cities on different continents, the report evaluates the congestion levels at different times of the day and on different days of the week”

Friday, June 6, 2014

Why Isn’t Canada Meeting Its Greenhouse Gas Emission Targets?

Allocating Canadian Greenhouse Gas Emission Reductions Amongst Sources and Provinces: Learning from the European Union, Australia and Germany (185 page pdf, Douglas Macdonald, Jochen Monstadt, Kristine Kern, University of Toronto, Apr 2013)

ghg sources canada 2008Also discussed here: Kyoto Protocol (Wikipedia)

And here: State-and-Trends of the Environment: 1987–2007 Chapter 2 Atmosphere (44 page pdf, United National Environment Program, 2008)

And here: History of the Global Climate Change Regime (18 page pdf, Daniel Bodansky, 2012)

And here: 2014 Air Quality and Climate Change Management Plan (165 page pdf, City of Ottawa Environment Committee, May 20, 2014)

The quick answer to the question posed is: lack of engagement and consensus for action by the provinces who have prime responsibility for energy, environment and natural resources. Today, we review an academic report and analysis of the reasons for Canada’s failure to meet international agreements to reduce greenhouse gas emissions since the first commitments were made by the Prime Minister at the United Nations-sponsored “Changing the Atmosphere Conference” in Toronto in 1988 - where it was agreed that Global CO2 emissions be cut by 20% by 2005 but without national obligations which came later with the 1997 Kyoto Protocol. He made this commitment without having prior provincial support to do so – an issue not a faced by most other heads of government, even from nations with states or provinces, such as Australia or Germany (whose efforts to reduce GHG emissions are also analysed in this report).

The lack of national leadership (and mandate), the lack of provincial consensus and the difficulty in getting provincial agreement, even with a national coordination secretariat (which existed from 1998-2003), is blamed on the uneven costs for implementing such a plan, with most of the costs and emissions coming from Alberta and Ontario whose energy and transportation sectors make up over 80% of the emissions for Canada. On top of this, the resistance of Canada’s largest trading partner, the USA, to agree to reductions has hampered Canadian efforts, let alone ratify the agreement under the Kyoto Protocol to reduce emissions by 6% (base year 1990) by 2012. The current administration in 2011 decided to withdraw from the Kyoto Protocol and adopt a goal of a 17% reduction in total emissions (from a 2005 base year) by 2020, consistent with American plans, but again without consensus on provincial responsibilities. ghg allocations canada    

Key Quotes:

“By 2020, existing federal and provincial programs will only achieve half of Canada’s goal of reducing greenhouse gas (GHG) emissions to 17% below the 2005 level.”

“if all provinces fully meet their targets… and without including reductions resulting from federal government policy, total Canadian emissions in 2020 would be 598.7 Mt. That would be a reduction of 246.5 Mt from projected Business as Usual level of emissions in 2020"

“The Canadian Constitution gives ownership of natural resources to the provinces, which means they have guaranteed jurisdiction in the policy fields of environment and energy; and the larger provinces such as British Columbia, Alberta, Ontario, and Quebec have consistently resisted federal government intrusion into what they see as their environmental policy jurisdiction”

“Canada is in the process of implementing not just one climate-change plan; instead, it has eleven plans,.. being implemented separately and almost completely without coordination by eleven governments—the federal government and ten provincial governments. … a “fragmented ‘go-it-alone’ approach.”

“The main thing which must be co-ordinated is the allocation of the total GHG reduction amongst the various sources, such as transportation, resource extraction, building insulation, and manufacturing. Since their reduction costs vary, economic efficiency means we cannot ask each source to reduce by the same percentage amount.”

“Both Australia and Germany are relatively centralized federated states, meaning that, unlike Canada, in those countries national climate-change policy can be made by the national government alone, without explicit agreement among subnational governments on cost allocation.”

“In Canada, Alberta and Saskatchewan, presumably due to the fact they have faced higher per-capita reduction costs than other provinces have, not surprisingly, been the provinces most resistant to national policy”

"Due to immigration, the Canadian population increased steadily from 1990 to 2011, with a 24.63% net increase over that time” [an increase of about 1% per year]    
Enhanced by Zemanta

Thursday, April 3, 2014

Why Do We Subsidize Parking for Public Transit Users?

The Dirty Truth Behind Park & Rides (Matt Steele, StreetsMM, Mar. 18, 2014)


Today we review some suggestions from Minneapolis where the proposal to expand their park and ride facilities is assessed in terms of what it costs to give the parking away free (when it costs $10 per user) compared to other more cost effective options, such as doing away with higher express fares at peak use times or producing more revenue from the lot areas than giving away parking. Bottom line is that the number of extra riders and revenue produced by free parking is less than improvements to the transit system itself which would make the latter more efficient and double the net revenue. A good question whether this arguments holds for cities such as Ottawa that are sprawled out over more than 2,800 km2 where some suburban and rural areas are poorly or expensively served by public transit. But it is always useful to consider impacts on ridership and the costs of subsidies in running very expensive public transit systems.

   parka nd ride  

Key Quotes:

 “For less than the cost of two Maplewood park & rides serving up to (2×580=) 1160 parked cars, we’re building a full Arterial BRT line on Snelling Avenue scheduled to open next year. Those improvements will serve an estimated ridership of 8,700. And, unlike additional parking spaces, these amenities serve all riders (not just the 3,000 new ones). This is 7.5 times more productive than the same investment in parking.”

“If the new Maplewood Mall ramp capital is amortized over a 20 year period, we’re spending roughly $1200 per space per year to have the capacity for 580 new park & riders. At 240 workdays a year, a $5 parking fee would be necessary just to pay off the investment. $5 per person in addition to the transit fare to operate the bus. A $5 parking fee which wouldn’t even pay for maintenance, snow removal, and lighting – so let’s bump that up to $7.”

 “Modern technology allows us to decouple parking costs from other costs, which is the first step. The near-ubiquity of GoTo cards (especially on commuter routes) allows for us to have a fast way to account for parking transactions, possibly with an RFID-equipped entry gate or a validation match to a parking space.”

“The second step is to eliminate the express fare for those who do not consume parking spaces.” “Suburban park & riders are clearly not paying $9.50 to park before paying an additional fare to get on the bus. Someone else is paying to subsidize their car storage habits. And you’re it.”
Enhanced by Zemanta

Wednesday, February 19, 2014

Solving Congestion Problems in China’s Biggest Cities


 A big reason Beijing is polluted: The average car goes 7.5 miles per hour( Gwynn Guilford, Quartz, Jan. 3, 2014)


Also discussed here: China's Urban Nightmare: Gridlock(The Wall Street Journal, Jan. 2, 2014) Also here: Spatial and Social Characteristics of Urban Transportation in Beijing(9 page pdf, Jiawen Yang, Transportation Research Record: Journal of the Transportation Research Board,2010)

Today we review a report that compares the degree of traffic congestion in Beijing and Wuhan with large western cities that have similar trends on the growth of car ownership (and urban road building) with GDP and with the degree to which congestion has strangled traffic flows to a point where drivers in Beijing average only 12 kph. Interesting that Wuhan implemented a congestion pricing system in 2011 while more progressive cities such as New York City have failed to proceed with it as one of the most effective ways of reducing urban congestion.

Also interesting that Beijing’s twin city in Canada shares an almost identical ratio of km road lanes to urban area (of about 3-4 to 1), an indicator of poor urban transportation design (Ottawa also lacks modern Light Rail Transit, depending only on buses and planning to get a basic LRT system in the next 10-15 years).

  road density  

Key Quotes:

“The increase in automobile ownership in relation to the growth in China’s gross domestic product is similar to that in the United States, South Korea, Japan, and Germany.”

“Beijing and the southern boomtown of Shenzhen were second only to Mexico City in terms of commuter misery…Beijing hosts more than 10 million residents at its core built-up area, which is served by the five ring roads and other connecting roads.”

“about two years ago Wuhan became the first Chinese city to charge electronic tolls to reach its bustling downtown area, joining more-global cities such as London and Singapore.”

“Wuhan introduced its electronic toll-collecting system in 2011. It uses a transponder people carry in their cars, enabling their accounts to be automatically charged. The system charges at least eight yuan (about $1.30) for every use of the bridges and the tunnel. Alternatively, they can buy an annual card for unlimited usage. Bus and taxi drivers are charged 500 yuan a year, while private individual drivers pay 2,400 yuan.”

“premature death caused by traffic congestion will cost the US at least $13 billion in 2020 and $17 billion by 2030, in 2007 dollars. And that toll is clearly higher in cities like Los Angeles, where cars are de rigeur. LA incurred more than $3 billion in pollution-related mortality costs in 2010—much greater than Boston’s $125-or-so million,”
Enhanced by Zemanta

Wednesday, January 29, 2014

What is Public Transit's Role (if any) in Reducing Traffic Congestion?

Do density and transport resolve congestion? (Cities Matter, Dec. 11, 2013)

Today we review a look at the links between congestion on the one hand and transit, population density and city location. The short answer is that better transit does not correlate with less congestion. The only significant link is between higher urban population density and higher congestion. This is the opposite way to what planners frequently assume- that higher urban densities process more efficient public transit and less congestion. A side result reveals which cities have poorer performance than expected and here there are surprises: in Canada, Vancouver, Ottawa and Montreal have 5-10% higher congestion than Toronto, Calgary or Edmonton. As the contrarian blogger who wrote this article, Phil McDermott , wryly comments: “transit creates a commitment to a land use pattern that promotes congestion, delaying or distorting the decentralisation of employment that might otherwise occur in a well-connected city”.

What was not analysed is the impact of road pricing on congestion and the results from cities which have tried it- from Dubai to Stockholm and from London to Singapore seem to point to this being the best way to reduce congestion and pollution. The conclusion seems to point to a combination of lower population density (i.e. sprawled cities) combined with road pricing as the best option to address congestion in (already sprawled) cities in the US and Canada, rather than expanding expensive and, from this analysis, ineffective
public transit. 


Key Quotes:

“Among the North American cities only population density was statistically significant, explaining 52% of the differences in morning congestion among cities. By and large, as densities increase, so does congestion”

“Boston has higher levels of congestion (48%) than predicted (27%) on the basis of its density (just 800 persons per square km)… The other poor performers based on this analysis include both high density Montreal, Ottawa, and Vancouver, and low density Atlanta”

“The results for European cities were completely different, adding weight to the argument that context matters:.. the poor performers are Warsaw (density 3,100), Marseilles (1,300), Istanbul (9,700), Toulouse (1,100), Rome (3,400) and Brussels (2,600). The better performers include the smaller cities of Malmo (density 3,600), Zagreb (5,700), Valencia (3,000), Seville (5,600) and Bern (2,300).”

“the European evidence also offers no grounds for suggesting that density is a prerequisite either to better commuting conditions or that congestion reflects the quality of transit systems.”
Enhanced by Zemanta