Land transport’s contribution to a 2°C target - Key Messages on mitigation potential, institutions and financing of low-carbon land transport for policy makers on transport and climate change (35 page pdf, Heather Allen, Manfred Breithaupt, Lew Fulton, Kain Glensor, Sanjing Han, Cornie Huizenga, Oliver Lah, Katie Millard, Michael Replogle, Shritu Shresta, Bridging the Gap Initiative and the Partnership on Sustainable, Low Carbon Transport, Sep. 23, 2014)
Also discussed here: The Bridging the Gap Factsheets - Climate Finance – Opportunities and Challenges for Transport (6 page pdf, Bridging the Gap Initiative, Oct, 2012)
Today we review an early release of a report that covers the role of the transportation sector in addressing climate change one year ahead of decisions in the fall of 2015 at the U.N. Investment in and application of a number of measures, including both technology and personal behaviour change, could reduce energy demand by over 50% below the internationally accepted goal of keeping climate warming below 4 degrees C and also produce co-benefits to reduce traffic congestion world-wide (which has a cost as high as 10% GDP).
Key Quotes:
“Transport in total currently accounts for about 23% of global energy-related greenhouse gas emissions of which 75% are derived from land transport.”
“a combination of technological and behavioural measures could decrease final energy demand in 2050 for urban passenger transport by at least 55% below an IEA defined baseline of a 4o Celsius temperature increase scenario”
“so-called co-benefits address areas that are of much more pressing concern to decision makers ..Traffic congestion and increased travel time in particular negatively impact development and are a major cost. This varies from 1.2% of GDP in the UK… 3.4% of GDP in Dakar, Senegal, 4% in Manila, Philippines .. 3.3%-5.3% of GDP in Beijing..1%-6% of GDP in Bangkok…10% of GDP in Lima, Peru where travel can consume up to four hours daily”
“A shift towards low-carbon mobility could potentially result in savings of up $100 trillion in public and private spending on transportation vehicle and infrastructure and vehicle capital and operating costs along with fuel costs, primarily from a reduction in road construction requirements and vehicle purchase requirements.”
“Averaged across all world regions, urban light-duty vehicle travel (VKT) is cut by 50% in 2050 from the Baseline to the High Shift scenario…The goal of replacing the reduced car travel with high quality transit and safe non-motorized modes … appears achievable in every part of the developing world and is only problematic in some OECD countries, particularly car-dominated countries like the United States.”
“land transport is well represented in the September 23 Climate Summit with 5 initiatives under three Action Areas: Transport (electric mobility, railways and public transport); Energy (fuel economy) and Petroleum and Industry (green freight). These initiatives have created the largest momentum for low carbon transport in the transport industry so far.”
Thursday, November 27, 2014
Tuesday, November 25, 2014
How is Ontario Meeting its Plans to Reduce Carbon Emissions?
Ontario’s Climate Change Update 2014 (42 page pdf, Ontario Ministry of Environment and Climate Change, Oct. 2014)
Also discussed here: Ontario Targets for Greenhouse Gas Emissions (Jennifer Kalnins Temple, Envirolaw, Oct. 3, 2014) Today we review a report from Canada’s largest province on how it is meeting climate plan commitments to reduce greenhouse gas emissions from 1990 to 2012 and how it intends to reduce these further by 80% by 2050. Unlike the federal government and the City of Ottawa which chose the easier reference year of 2005, the province assesses its progress relative to emissions in 1990, the reference year set by the United Nations in its Framework Convention on Climate Change and Kyoto Protocol to 2012 which is to be updated at the Paris climate conference in 2015. To date Ontario has reduced its emissions by 6% which, in absolute terms, is the greatest reduction of any province in Canada and just ahead of Quebec. The gains came from improvements on electrical generation from a switch from coal. For the future, the biggest emitting sectors are industry and transportation.
Key Quotes:
« unlike the federal government, Ontario is measuring its greenhouse gas reductions according to the U.N. Framework Convention on Climate Change (UNFCCC) and the Kyoto Protocol, which use 1990 as the base year for setting targets.”
“Ontario and Quebec are the only jurisdictions in Canada with significantly declining greenhouse gas emissions. Ontario’s emissions decreased by 6% and Quebec’s decreased by 7%. In absolute emissions, Ontario’s decrease of 10 Mt since 1990 is the largest in Canada.”
“Ontario’s targets for 2020 are to reduce greenhouse gas emissions to 15% below 1990 levels, and for 2050 to achieve emissions that are 80% below 1990 levels.”
“Several major transit projects underway in the Greater Toronto and Hamilton Area (GTHA), Ottawa and Waterloo will come into service by 2020, which are projected to result in overall GHG reductions.”
“By 2020, total industrial emissions are projected to increase by 15% from the 2012 level, both combustion and process emissions….Looking ahead to 2020 and beyond, we will look to continue to work with industry towards the goals of clean-tech innovation and high resource productivity. “
“Phasing out coal-fired electricity generation is the single largest climate change initiative in North America to date … projected to reduce Ontario’s emissions by 32.5 Mt in 2020 from business-as-usual.. In the future…to further develop Ontario’s clean energy sources and new technologies, as well as promote energy and resource efficiency and conservation across government, and among businesses and individuals.”
Related articles
- UCLA researchers address challenges cities face from climate change
- Delhi Dilemma
- EU climate compromise ~ I will if you will
- The Good, The Bad, And The Ugly Of Climate Change
- Why Isn't Canada Meeting Its Greenhouse Gas Emission Targets?
- Can We Mitigate Climate Change in Short-Term without Nuclear Energy?
- Which Organizations Impede Progress on Reducing Climate Change Impacts?
- How Are Canadian Cities Adapting to Climate Change?
- What Makes a Sustainable City?
- Will Outdoor Skating Rinks Survive Anthropogenic Global Warming?
Thursday, November 20, 2014
How Much of a Health Threat is it to Live Near a Highway?
Residential Proximity to Major Roadways and Prevalent Hypertension Among Postmenopausal Women: Results From the Women's Health Initiative San Diego Cohort (12 page pdf, Kipruto Kirwa, Melissa N. Eliot, Yi Wang, Marc A. Adams, Cindy G. Morgan, Jacqueline Kerr , Gregory J. Norman, Charles B. Eaton, Matthew A. Allison and Gregory A. Wellenius, J Am Heart Assoc., Oct. 1, 2014)
Also discussed here: Hypertension risk rises closer to major roadways (ScienceDaily, Oct. 1, 2014)
And here: Living Near a Highway May Be Bad for Your Blood Pressure (MedlinePLus, Oct. 1, 2014)
Today we review research into the possible links between the prevalence of hypertension for older women (average age 65) and how far they live from a busy roadway or highway. Results indicate that women living within 100 m of a busy road have a 22% higher risk of developing high blood pressure which equates to aging two additional years, compared to women living more than 1000 m from a busy road. The reason for hypertension which affects 1/3 of the USA population may be either noise or air pollution related to emissions from traffic or both.
Key Quotes:
“Among more than 5,000 postmenopausal women, those who lived within 109 yards of a busy road had a 22 percent greater risk of developing high blood pressure than women living at least half a mile away”
“When comparing women living 1000 m versus 100 m from a major roadway, we observed an increase in prevalence of hypertension corresponding approximately to a 2-year increase in age in this cohort.”
“A large body of literature indicates that short-term exposure to traffic-related air pollution is associated with increased cardiac sympathetic nervous system activity, vascular resistance, and blood pressure.”
“Hypertension affects _78 million or a third of US adults and _1 billion adults worldwide.”
"Approximately 80 percent of people in the U.S. now live in cities, so understanding the health consequences of the urban environment in which we live is important for individuals, public health officials and city planners,"
"potentially be due to exposure to higher levels of either traffic-related air pollution or traffic-related noise. In this study, we could not distinguish between these two possibilities,”
"High blood pressure is a major modifiable risk factor for heart attacks, stroke, heart failure, kidney failure and premature death from heart disease."
“the odds of hypertension were 1.22 to 1 for those living closest, 1.13 to 1 for those between 100 and 200 meters, and 1.05 to 1 for those between 200 and 1000 meters from a major roadway”
Related articles
- Are Houses by the Highway a Public Health Risk?
- Tobacco Smoke and Roadway Air Pollution Linked With Childhood Obesity
- Air Pollution Linked to Higher Rates of Chronic Kidney Disease
- Can air pollution make kids obese?
- Air Pollution May Be Linked to Higher Rates of Kidney Disease
- How Depressing is Traffic-Related Air Pollution for the Elderly?
- Has Health Impacts fromToronto's Traffic-Related Air Pollution Become Worse?
- Monitoring Pollution Near Multi-Lane Highways
- Has Health Impacts fromToronto's Traffic-Related Air Pollution Become Worse?
- What Sources of Air Pollution Cause the Most Premature Deaths?
Tuesday, November 18, 2014
What is the Health Impact from Short Term Exposure to a Combination of Air Pollutants?
A Comparison of Risk Estimates for the Effect of Short-Term Exposure to PM, NO2 and CO on Cardiovascular Hospitalizations and Emergency Department Visits: Effect Size Modeling of Study Findings
(14 page pdf, Ellen Kirrane, David Svendsgaard, Mary Ross, Barbara Buckley, Allen Davis, Doug Johns 1, Dennis Kotchmar, Thomas C. Long, Thomas J. Luben, Genee Smith and Lindsay Wichers Stanek, Atmopshere, Dec. 6, 2011)
Today we review research that statistically examines the degree to which one pollutant in combination with one or two others (CO, NO2 and PM) on a short term basis (a few days after exposure) affects health impacts and how much correlation exists between pollutants in causing these impacts. Results indicate that there is an association between NO2 and PM as one might expect this from transportation emissions and also the association between NO2 and cardiovascular diseases. The authors recommend a greater density of monitors to measure the pollutant concentrations and to isolate the influence of each.
Key Quotes:
“The objective of this analysis was to use meta-regression methods to model effect estimates for several individual yet correlated NAAQS pollutants in an effort to identify factors that explain differences in the effect sizes across studies and across pollutants.”
“One previous multicity analysis conducted in Europe reported that 84% of the heterogeneity in the PM10 estimates across the cities examined could be explained by the PM10-NO2 correlation.”
“Associations between short term NO2 exposure and cardiovascular hospitalizations were also consistently observed”
“the suggestion that NO2 effect estimates are higher when PM10 concentrations are also elevated may suggest a joint effect of these pollutants, or that PM is an indicator for poor air quality in general. “
“we present preliminary results suggesting that study methodology, concentrations of other pollutants, and monitor density may influence the observed effect estimates in single-city studies of air pollution and cardiovascular hospitalizations or ED visits. Our results may be useful in the design of future studies or aid in interpreting health effects in a multipollutant context. “
Related articles
- Boris Johnson admits London's Oxford Street is one of world's most polluted
- Miriam Dalli to report on measures to reduce vehicle emissions
- Does your metro city have clean air?
- Wearable Air Quality Monitor Helps Avoid Pollution Hot Spots
- EPA to award up to $4M to support community-scale monitoring of air toxics
Thursday, November 13, 2014
What Impact Does Increased Natural Gas from Fracking have on Plan to Reduce CO2 Emissions?
The effect of natural gas supply on US renewable energy and CO2 emissions (9 page pdf, Christine Shearer, John Bistline, Mason Inman and Steven J Davis, Environmental Research Letters, Sep. 24, 2014)
Today we review research that examines the impact of increased natural gas supplies for electrical generation in the USA as one factor among the existence of a strict or absent climate policy, the emergence of renewable energy sources and the net impact of CO2 emissions between now and 2055. Given the advantage in terms of lower carbon emissions from natural gas compared to coal (which is used for almost 50% of the energy used to generate electricity in the USA), hydraulic fracking is seen as a bridge toward a lower carbon future. However, the likelihood of increased leakage of greenhouse gases from fracking offsets this advantage, even if natural gas emissions are less dangerous in health terms than coal emissions (fine particulate matter). The paper points out that the key factor is a strict climate policy as, without it, a switch to ample natural gas may increase the cumulative emissions over the next 40 years. Also, an increase in natural gas from fracking would tend to reduce the growth of renewable energy sources with zero carbon emissions, such as solar and wind.
Key Quotes:
“Fossil fuels supply approximately 87% of the primary energy used worldwide, and the carbon dioxide (CO2) emissions from burning these fuels are the main cause of climate change”
“natural gas-fired power plants emit ∼57% less CO2 per kilowatt-hour (kWh) than coal-fired plants, and are on average 20% more efficient at converting fuel energy to electricity than coal plants”
“innovations in hydraulic fracturing technology have dramatically increased domestic supplies of gas”
“cumulative emissions increase by 5% (2.6 Gt CO2-eq) in the high gas scenario under our stringent climate policy when a leakage rate of 3% is assumed”
“ increased use of gas may not lead to substantial reductions in GHG emissions where gas competes with renewables in the energy market. On the other hand, the effect of more abundant gas supply on GHG emissions is so small that the quantity of methane leaked may ultimately determine whether the overall effect is to slightly reduce or actually increase cumulative emissions”
“The costs of wind and solar can be expected to decrease with increased deployment (e.g., 30), but more abundant natural gas may delay deployment and thereby increase the time period over which renewable energies decrease in cost.”
“coal use will continue to decline in the US electricity sector, but will decline most if natural gas is abundant and stringent climate policies are adopted. Similarly, the use of renewable technologies continues to increase in our model results, but increases least when natural gas is abundant and there is no new climate policy.”
Tuesday, November 11, 2014
World-wide Causes of Death from Climate Change to the Mid 21st century
Quantitative risk assessment of the effects of climate change on selected causes of death, 2030s and 2050s (128 page pdf, Editors: Simon Hales, Sari Kovats, Simon Lloyd, Diarmid Campbell-Lendrum, World Health Organization, Sep. 21, 2014)
Also discussed here: Quantitative risk assessment of the effects of climate change on selected causes of death, 2030s and 2050s (Press Release, WHO, Sep. 21, 2014)
Today we review an updated estimate of the impact of climate change on health by the World Health Organization. Not including deaths from extreme events, the WHO estimates that an additional 241,000 deaths per year by 2030 (rising to 250,000 /yr to 2050) will be caused by climate change impacts that include under-nutrition of children, malaria, diarrhea and heat stress for the elderly. The greatest impacts geographically are in southeast Asia and India with significant impacts also in central and southeast Africa and southeast USA. Because of sea level rise brought about by climate warming and sea ice melt, coastal floods caused by cyclones. While reductions in emissions and mitigation may reduce some of the impacts, deaths from heat exposure and stress are expected to continue to rise above 100,000/yr by 2050.
Key Quotes:
“Global climate-health models were developed for a range of health outcomes known to be sensitive to climate change: heat-related mortality in elderly people, mortality associated with
“Compared with a future without climate change, the following additional deaths are projected for the year 2030: 38 000 due to heat exposure in elderly people, 48 000 due to diarrhoea, 60 000 due to malaria, and 95 000 due to childhood undernutrition.”
“climate change is expected to cause approximately 250 000 additional deaths per year between 2030 and 2050” “by the 2050s, deaths related to heat exposure (over 100 000 per year) are projected to increase.”
“Under a base case socioeconomic scenario, we estimate approximately 250 000 additional deaths due to climate change per year between 2030 and 2050.”
“avoiding climate-sensitive health risks is an additional reason to mitigate climate change, alongside the immediate health benefits that are expected to accrue from measures to reduce climate pollutants, for example through lower levels of particulate air pollution”
Also discussed here: Quantitative risk assessment of the effects of climate change on selected causes of death, 2030s and 2050s (Press Release, WHO, Sep. 21, 2014)
Today we review an updated estimate of the impact of climate change on health by the World Health Organization. Not including deaths from extreme events, the WHO estimates that an additional 241,000 deaths per year by 2030 (rising to 250,000 /yr to 2050) will be caused by climate change impacts that include under-nutrition of children, malaria, diarrhea and heat stress for the elderly. The greatest impacts geographically are in southeast Asia and India with significant impacts also in central and southeast Africa and southeast USA. Because of sea level rise brought about by climate warming and sea ice melt, coastal floods caused by cyclones. While reductions in emissions and mitigation may reduce some of the impacts, deaths from heat exposure and stress are expected to continue to rise above 100,000/yr by 2050.
Key Quotes:
“Global climate-health models were developed for a range of health outcomes known to be sensitive to climate change: heat-related mortality in elderly people, mortality associated with
- coastal flooding…
- diarrhoeal disease in children…
- malaria ..
- dengue ..
- undernutrition (stunting) ..”
“Compared with a future without climate change, the following additional deaths are projected for the year 2030: 38 000 due to heat exposure in elderly people, 48 000 due to diarrhoea, 60 000 due to malaria, and 95 000 due to childhood undernutrition.”
“climate change is expected to cause approximately 250 000 additional deaths per year between 2030 and 2050” “by the 2050s, deaths related to heat exposure (over 100 000 per year) are projected to increase.”
“Under a base case socioeconomic scenario, we estimate approximately 250 000 additional deaths due to climate change per year between 2030 and 2050.”
“avoiding climate-sensitive health risks is an additional reason to mitigate climate change, alongside the immediate health benefits that are expected to accrue from measures to reduce climate pollutants, for example through lower levels of particulate air pollution”
Related articles
- How Does Air Pollution Impact the Health of Children?
- What is the Answer to Avoiding Urban Congestion and Traffic-Related Air Pollution that accompanies Increased Car Dependence?
- Was the Club of Rome Correct in Warning of a Global Collapse of Resources and Population?
- What is the Answer to Avoiding Urban Congestion and Traffic-Related Air Pollution that accompanies Increased Car Dependence?
- How Does Air Pollution Affect the Health of the Elderly?
Thursday, November 6, 2014
What is the Answer to Avoiding Urban Congestion and Traffic-Related Air Pollution that accompanies Increased Car Dependence?
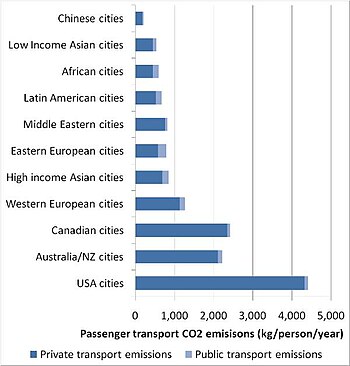
English: Graph of CO2 emissions by city for the year 1995. Graph created by me from data published in Kenworthy, JR (2002) Transport Energy Use and Greenhouse Gases in Urban Passenger Transport Systems: A Study of 84 Global Cities / Millennium Cities Database UITP KENWORTHY JR* (Photo credit: Wikipedia) |
Today we review a paper that examines the trend toward increased urban car use, the consequences in terms of greenhouse gas emissions, and the opportunities that exist to reduce these emissions. Under the “high shift” scenario, urban transportation emissions could be reduced by 40% world-wide with savings of $100 trillion in operating and infrastructure costs. Putting more funding into public transit is not necessarily the best way to make these savings, but rather investments to promote cycling and walking.
Key Quotes:
“If the world's cities focused their investments on expanding public transportation, walking and cycling, they could save more than $100 trillion in public and private capital and urban transportation operating costs between now and 2050”
“In a "high shift" scenario with far greater urban passenger travel by clean public transport and non- motorized vehicles … roughly 1.7 gigatons of carbon dioxide could be eliminated each year—a 40 percent reduction in urban passenger transport emissions—by 2050.”
"Transportation, driven by rapid growth in car use, has been the fastest-growing source of CO2 in the world….While every part of the global economy needs to become greener, cleaning up the traffic jams in the world's cities offers the least pain and the most gain."
“Transportation emissions in China… are expected to mushroom in the coming decades, from less than 200 megatons of CO2 annually today to nearly 1,200 megatons of CO2 in 2050…India will also see a huge jump in urban transportation emissions, from about 70 megatons of CO2 today to more than 500 megatons in 2050.”
"Unmanaged growth in motor vehicle use threatens to exacerbate growing income inequality and environmental ills, while more sustainable transport delivers access for all, reducing these ills,"
“mass transit is a day dream, fostered by politicians…the trains are rarely full, and are less efficient than autos, and because people have to be transported to and from the system, and once at their destination, must be transported by other means, mass transit almost always INCREASES Greenhouse Gas emissions. And when you rank mitigation projects by dollars invested vs CO2 emissions reduced, mass transit doesn't even make the list, it's so terrible.”
"I must admit there's a question about whether business as usual is even plausible, because many cities are going to run into infrastructure constraints and space constraints at some point…But that is the trend, the trend is such fast motorization rates that if nothing is done to try and redirect that, it looks like a very unsustainable future."
Related articles
- Shift to mass transit could save more than $100 trillion
- New Report Shows How to Reduce Vehicle Pollution, Create Financial Savings on a Global Scale
- Please Step Out of Your Car
- Study: Enormous Gains to Be Had From Sustainable Urban Transport
- IPCC Response Essay #2:Achieving Dramatic Reductions in Greenhouse Gas Emissions through Sustainable Development
- Call for action to tackle emissions
Subscribe to:
Posts (Atom)